Website Tracking Tools
Improve the digital user experience with SolarWinds® Pingdom®. Monitor your website’s performance and get insightful data about your visitors’ experience.

Identify bottlenecks and speed up your website.
Learn More
Real user insights in real time
Know how your site or web app is performing with real user insights
Learn More
Comprehensive set of turnkey infrastructure integrations
Including dozens of AWS and Azure services, container orchestrations like Docker and Kubernetes, and more
Learn More
Complete visibility into application issues
Pinpoint the root cause down to a poor-performing line of code
Learn More
Collect, search, and analyze log data
Quickly jump into the relevant logs to accelerate troubleshooting
Learn More
Use Cases By Industry
Use Cases by Challenge
Technical Documentation
Educational Resources
APM Integrated Experience
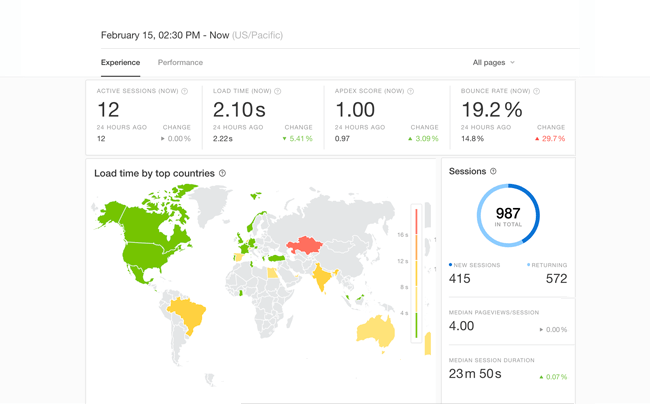
Use visitor tracking to understand the sources and locations of site traffic. Optimize your online presence where your visitors are more engaged. Real user monitoring provides instant insights into the end-user experience on your site. With live mapping, determine visual geographic hotspots. This solution helps identify bottlenecks with advanced filtering that segments real user data by browser, device, and location. Turn website visitors into potential leads by catering to their needs based on user behavior.
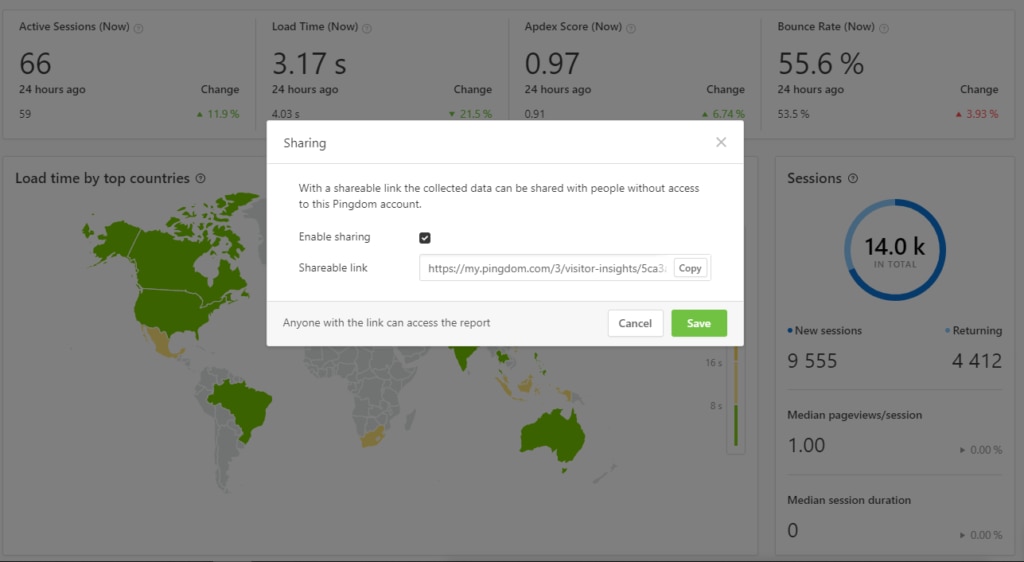
Pingdom allows the sharing and filtering of high-level report summaries with key stakeholders and customers. The reports include page-level metrics and analysis of your most important webpages. The reports display metrics like top visited pages, active sessions, and bounce rates over time. Errors can lead to higher bounce rates. A dip in traffic on a specific webpage could mean an error, slow loading time, and bounce rates.
Pingdom allows you to customize alerts based on the severity of the incident. Teams can choose to be notified via email, SMS, or push notification. Integrate alerts with applications like Slack, PagerDuty, Opsgenie, and more.
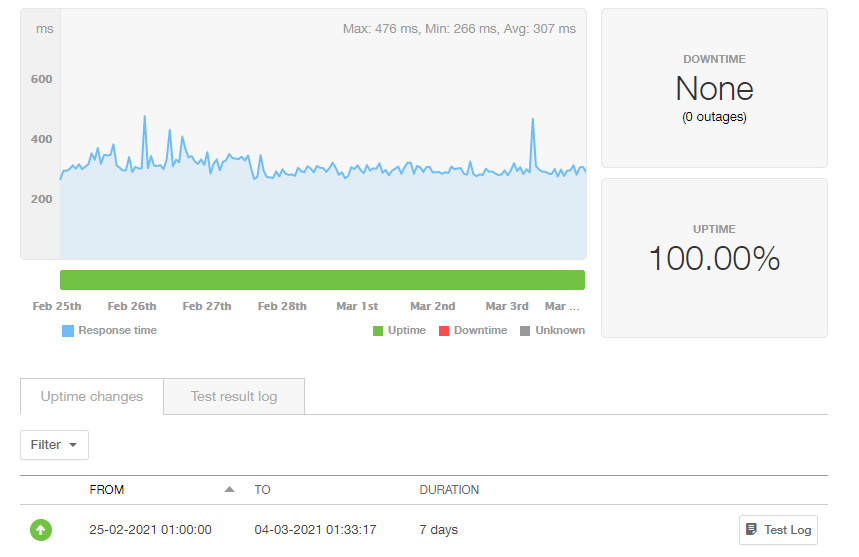
Proactively monitor the performance and availability of your websites and applications to eliminate potential errors before your customers experience a slow or broken site. Pingdom tests the availability of your application, servers, and website from over 100 global locations. This website tracking tool runs a root-cause analysis to quickly identify the reason for the errors. It allows teams to run a traceroute of the issue to examine server response code in-depth.
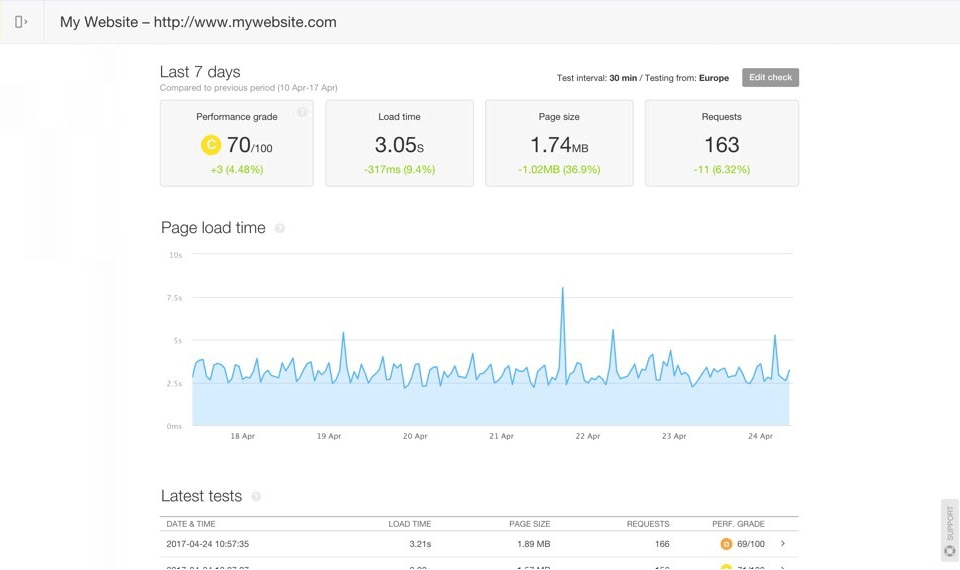
Pingdom examines load performance of your most important pages. It includes comprehensive visualizations and waterfall charts to provide insights about every element on a page, analyze the page performance at a granular level, and identify performance bottlenecks. The filmstrip feature takes a series of screenshots of the page every 500 ms to provide a clear understanding of the asset and rendering time.
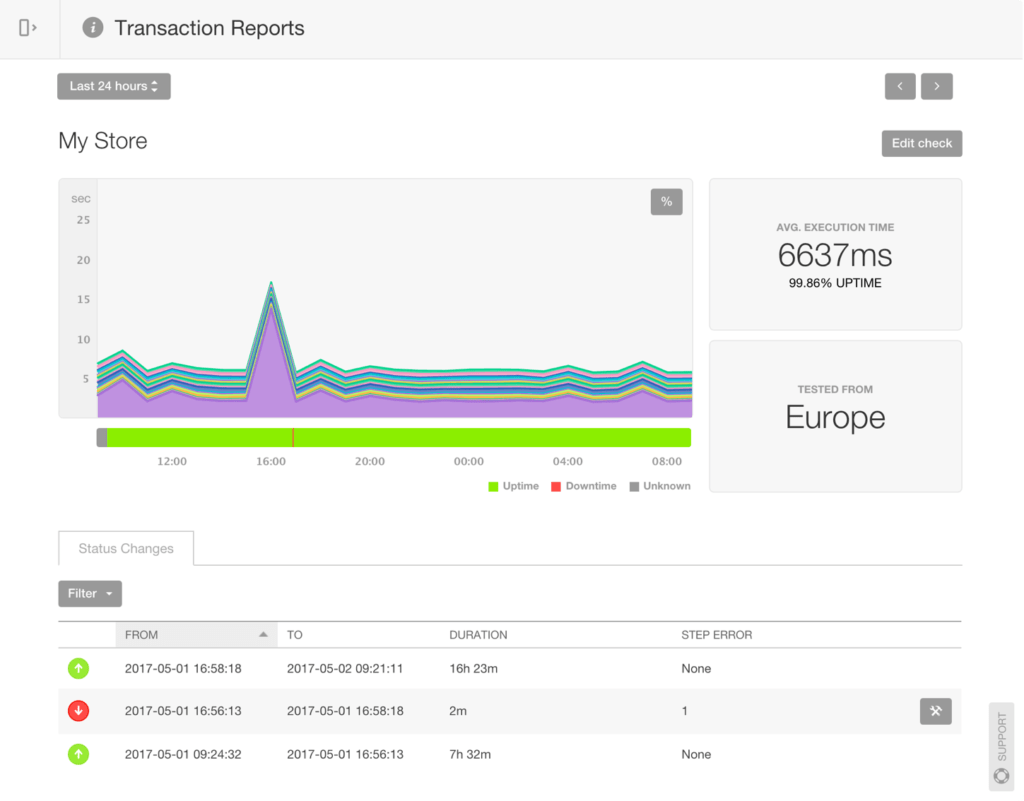
Pingdom helps ensure visitors’ interactions are smooth and flawless. It’s crucial to monitor whether the login, signup, and checkout flows are working as expected. Monitor both simple and highly complex transactions like user login, new user registration, and URL hijacking. Perform transaction monitoring in the real Chrome browser to understand real-world conditions. Set up tests without any coding knowledge and get automatic suggestions on how interactions should be performed.
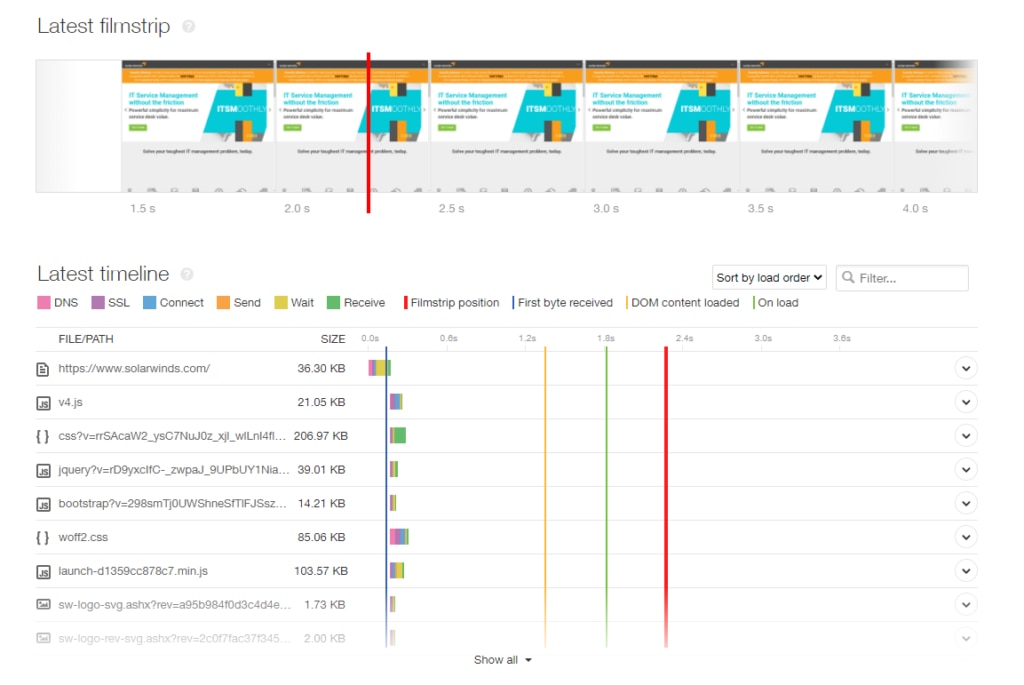
Identify webpage assets in need of improvement, optimize the content, and optimize page speed and key interaction flows. One of the possible reasons for slow website load times is bloated assets. Pingdom helps improve page speed by analyzing media content and identifying large files. Users can optimize the files based on the information offered by Pingdom.
Pingdom provides performance metrics such as page size, grades, and number of requests to help you identify performance gaps and make necessary changes. The tool provides 24/7 monitoring to help teams test page efficiency and check availability once per minute, monitor the website metrics that define business success, and track website KPIs to understand performance over time.
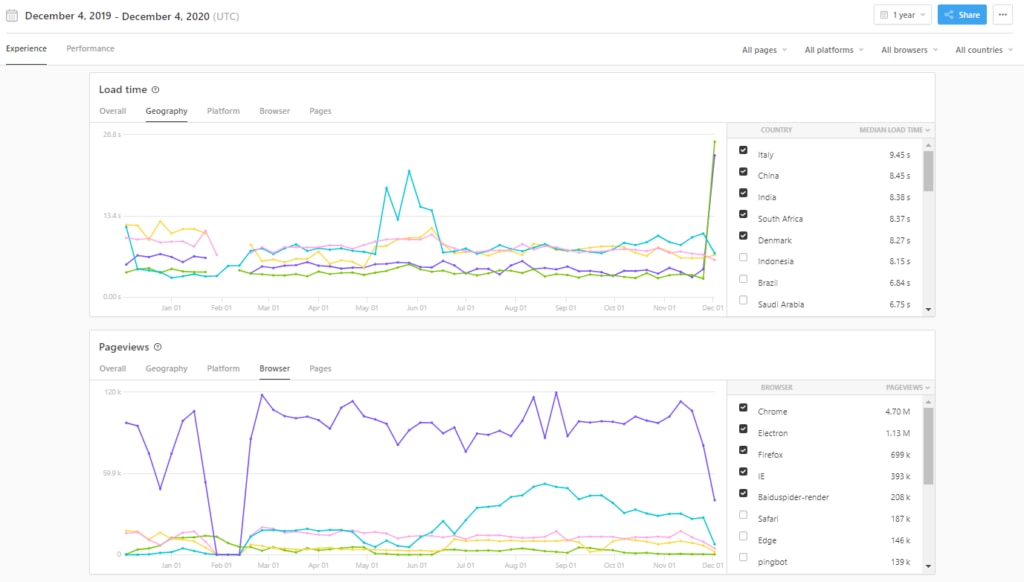
Pingdom stores the historical data of website performance metrics in the form of reports. Real user monitoring reports display usage metrics like top visited pages, top browsers, top platforms, bounce rates, and active sessions. These reports help in the analysis and improvement of site performance by allowing you to compare real user metrics over time. The data retention period is up to 400 days.
Didn’t find what you were after? Consider the SolarWinds ETS.
Gather data on how to improve your customers’ experience and gain meaningful insight on the performance of your website with Pingdom. Start tracking today and get your free trial.