Synthetic Monitoring

Simulate visitor interaction with your site to monitor the end user experience.

View Product Info

FEATURES

Simulate visitor interaction

Identify bottlenecks and speed up your website.

Learn More

Real User Monitoring

Enhance your site performance with data from actual site visitors

View Product Info

FEATURES

Real user insights in real time

Know how your site or web app is performing with real user insights

Learn More

Infrastructure Monitoring Powered by SolarWinds AppOptics

Instant visibility into servers, virtual hosts, and containerized environments

View Infrastructure Monitoring Info
Comprehensive set of turnkey infrastructure integrations

Including dozens of AWS and Azure services, container orchestrations like Docker and Kubernetes, and more 

Learn More

Application Performance Monitoring Powered by SolarWinds AppOptics

Comprehensive, full-stack visibility, and troubleshooting

View Application Performance Monitoring Info
Complete visibility into application issues

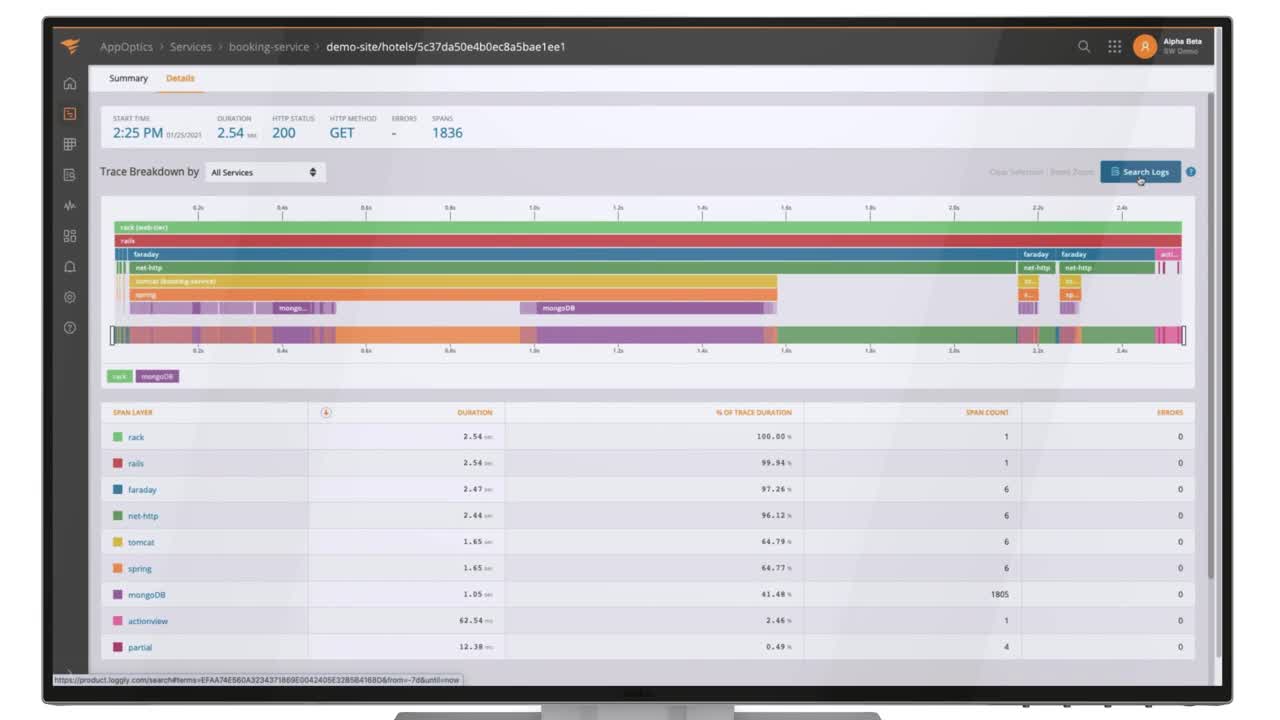
Pinpoint the root cause down to a poor-performing line of code

Learn More

Log Management and Analytics Powered by SolarWinds Loggly

Integrated, cost-effective, hosted, and scalable full-stack, multi-source log management

 View Log Management and Analytics Info
Collect, search, and analyze log data

Quickly jump into the relevant logs to accelerate troubleshooting

Learn More

NGINX Server Monitoring

NGINX server monitoring is crucial to maintain website operations and keep track of resources and web infrastructure. It ensures teams are equipped with the resources required to support applications running on NGINX servers. With an integrated monitoring suite, get a high-level view of end-user activity, server error rate, requests per second, and request processing time. Deploy the SolarWinds® APM Integrated Experience, which includes AppOptics, Pingdom®, and Loggly®, to monitor and accelerate NGINX overall availability and performance.

AO-NGINX-Config

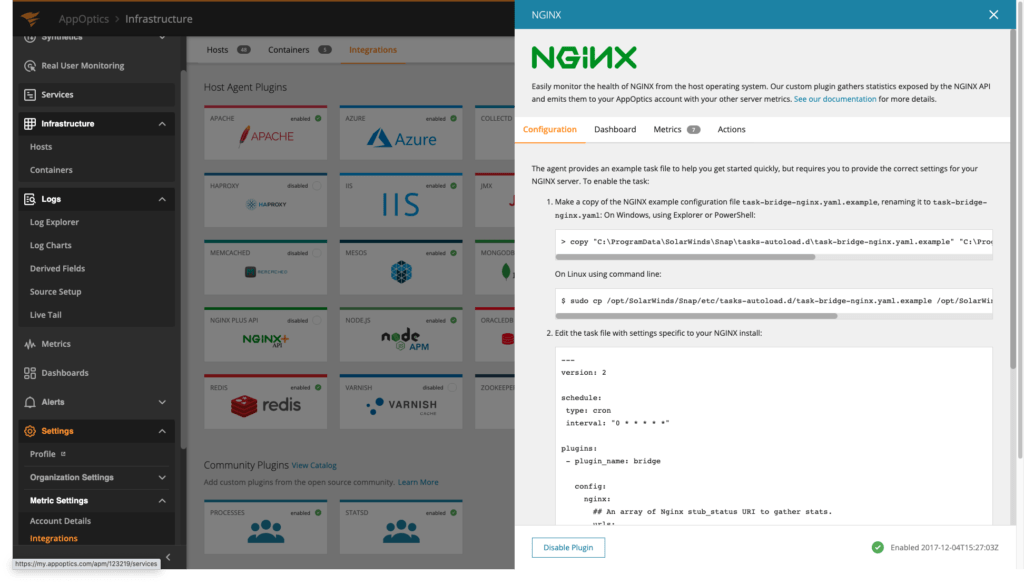
Improve NGINX Performance With AppOptics

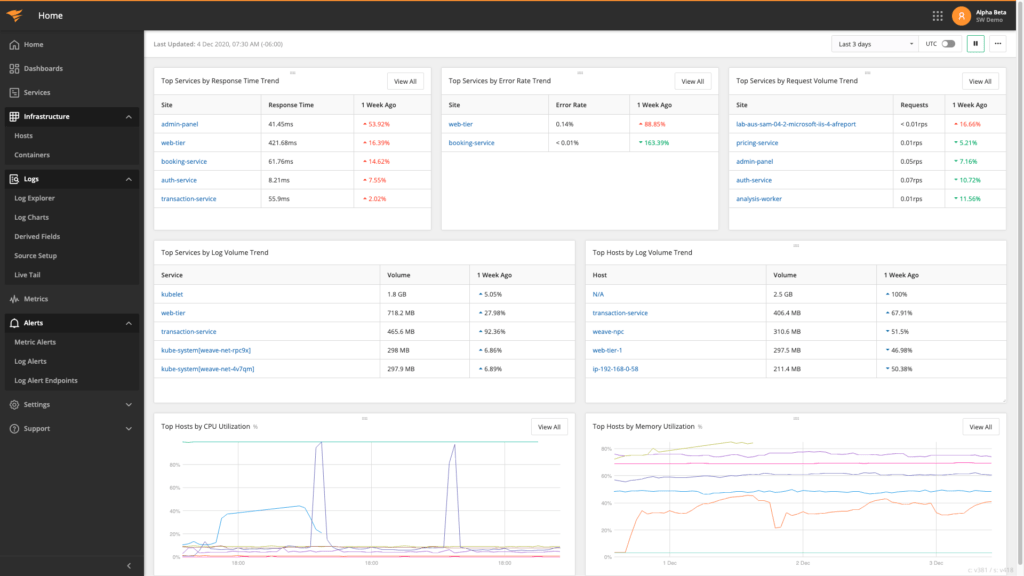
AppOptics server-side monitoring, with its powerful trace summaries and application service maps, helps you understand dependencies and services. It gives valuable insights into application and infrastructure performance, simplifying the NGINX troubleshooting process. Get complete visibility into NGINX servers and deliver high‑performing applications with a seamless end-user experience.

  • Examine NGINX performance, availability, and usage statistics
  • Collect server metrics from the NGINX stub status module
  • Analyze infrastructure, application, and business metrics
PD-Transaction

Observability With Server-Side and Client-Side Monitoring

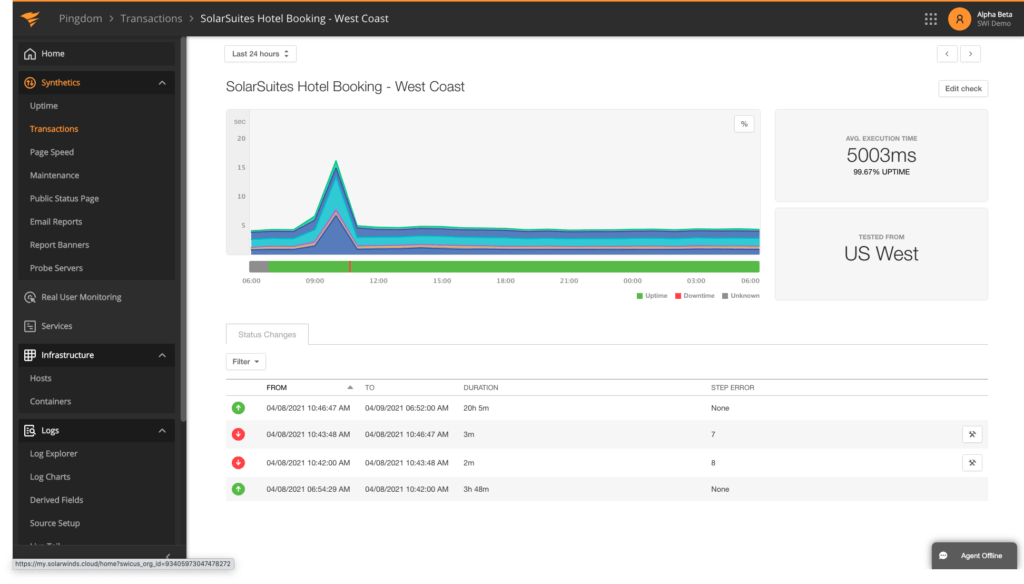
Pingdom (client-side) provides in-depth visibility into web application ’performance from the user’s perspective on NGINX servers. The dynamic features and advanced functionalities of the tool allow monitoring of critical transactions, how fast or slow critical pages load, real user traffic, and website uptime. Together, AppOptics and Pingdom offer proactive monitoring, effective data analysis, and quick reporting.

  • Pingdom Endpoint Availability Monitoring: Continuously monitor the availability, health, and performance of endpoints. Together, Pingdom and AppOptics efficiently track the status of all the transactions and endpoints and send real-time alerts the moment an outage is detected.
  • Pingdom Synthetic Monitoring: Simulate user behavior to detect performance issues before they affect end-user experience. Run synthetic tests to see how fast critical pages are loading and what elements of a page cause a page to load slow. Simulate the most important transactions to verify workflows are completing and are performant. Execute these tests from over 100+ locations around the world and deliver uninterrupted services to end users.
  • AppOptics Infrastructure and Application Monitoring: Get continuous visibility into the health of your critical systems and minimize mean time to resolution (MTTR). With 150+ out-of-the-box integrations, deliver flawless services worldwide. Perform distributed tracing, live code profiling, and exception tracking to identify the root cause of application performance issues.
AIE-Home-PD-AO

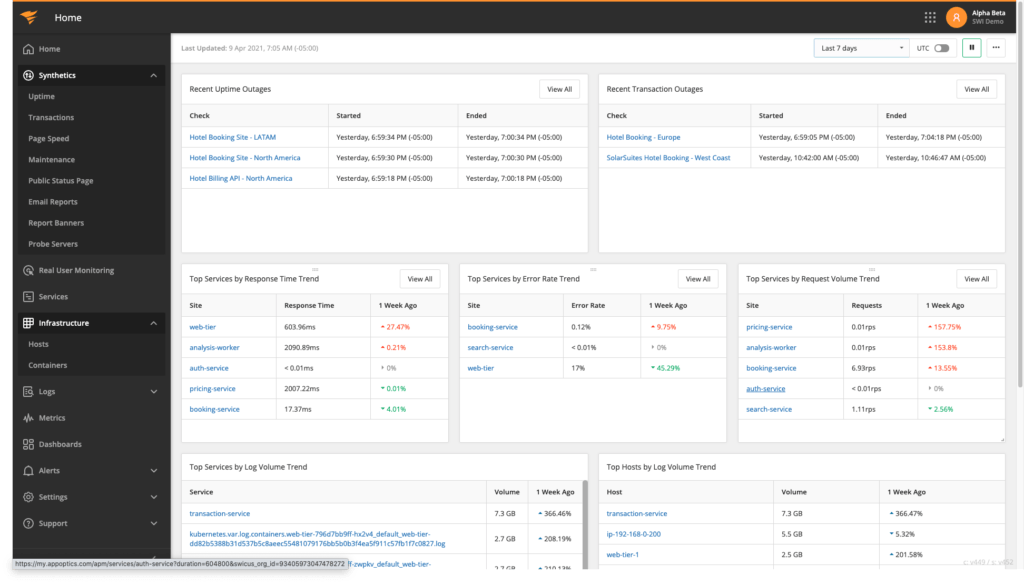
Deliver an Integrated APM Experience

Collecting NGINX metrics is vital as each metric represents how well the application is performing. Together, Pingdom and AppOptics monitor NGINX key metrics to ensure both the server and the infrastructure are operating efficiently.

Web Server-Specific Metrics

  • Current Connections: The number of active server connections such as bots, users, and automated tasks.
  • Current Requests: The number of total requests per server coming through each connection.
  • Connections Processed: The number of active or dropped connections handled by the server.

Infrastructure-Specific Metrics

  • CPU Usage: CPU utilization is the usage of the machine and is often used to estimate system performance.
  • Memory Usage: The amount of memory currently in use on the machine.
  • Network Bandwidth: The amount of information flowing in and out of the system.

Start a Free Trial for NGINX Server Monitoring

With the combined capabilities of AppOptics and Pingdom, monitor NGINX servers seamlessly through logs, distributed tracing, live code profiling, and exception tracking. Discover the advanced capabilities of this APM suite with the free trials.

Start monitoring for free