
On Sept 7, 2024, X (formerly Twitter) experienced a service disruption that lasted under an hour. It’s not the first time the microblogging site has made headlines for service disruptions. We previously reviewed four Twitter outages between Q4 2022 and Q2 2023. While X hasn’t released a postmortem or incident report, we can still learn valuable lessons by analyzing the incident.
In this article, we’ll unpack the X outage and review key takeaways for IT Ops and website administrators to apply to their monitoring and incident response strategies. Transaction monitoring is the process of observing and recording all interactions within an application, including user-initiated and internal actions. By monitoring transactions in the application, developers can identify and mitigate failures, timeouts, or performance bottlenecks before they cause an outage. Proactive monitoring and timely mitigation ensure an application’s availability and reliability.
Scope of the Outage
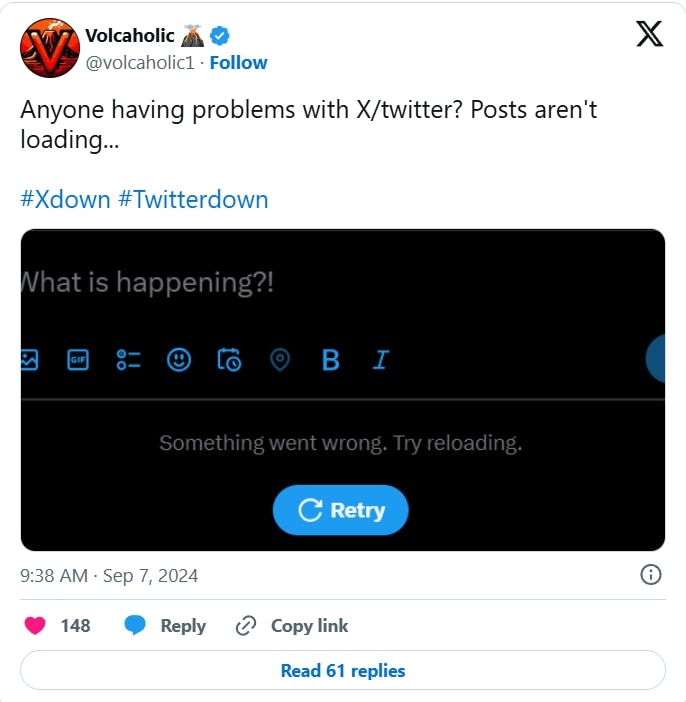
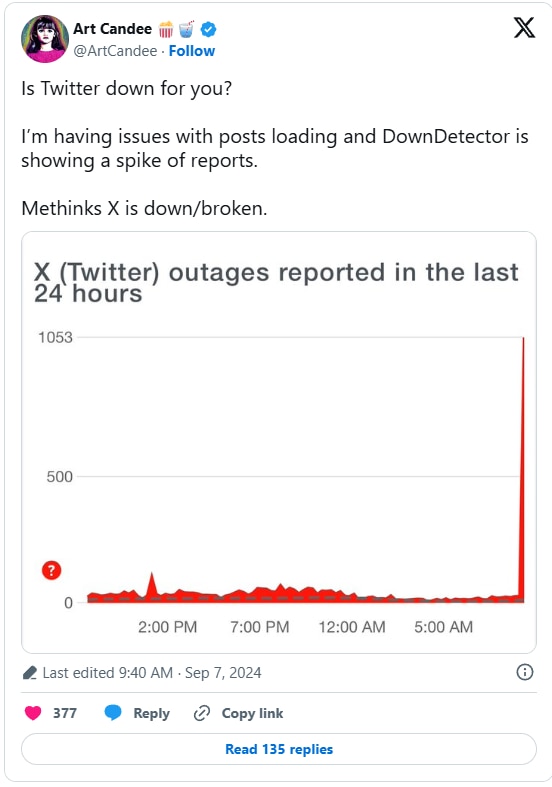
Based on thousands of Downdetector reports and posts on the X platform (examples below), the outage lasted under an hour. Reports of issues peaked at around 14:31 UTC on Sept 7 and dropped to roughly normal levels by 13:01 UTC.
During the incident, users reported issues such as:
- Failed loading of posts
- Empty tweet history when viewing a user
- Inability to access the site
- Unable to view timeline or followers
While some users reported these issues, others indicated the site was fine.
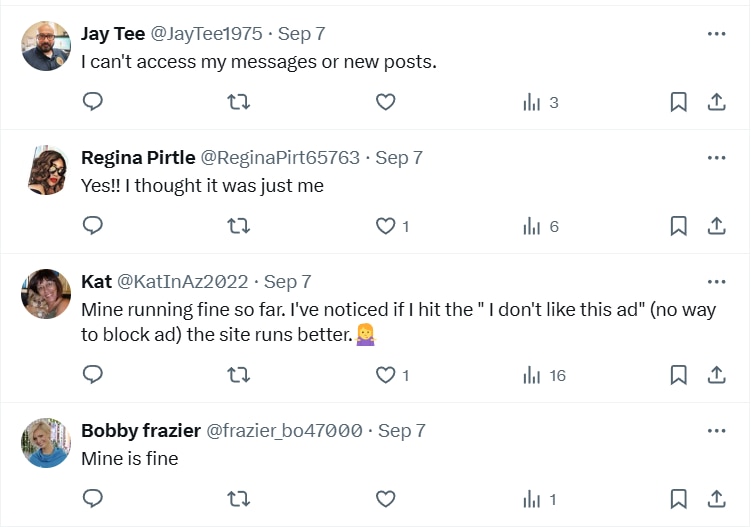
Examples of replies to a post about the X outage. (Source)
Root Cause
What was the root cause of the X outage? Simply put—we don’t know.
Nonetheless, the symptoms of the outage can help us narrow things down and make reasonable guesses about possible causes. While it helps when engineering organizations provide a deep dive with thorough incident reports and postmortems, analyzing an incident with the available information can still be a powerful thought exercise. So, let’s jump in.
Here’s what we can infer from the available data:
- Users commonly reported impacts to functionality such as loading posts and other historical information
- Users could make and reply to some posts during the incident
- The incident lasted less than an hour
We know X is a large-scale application distributed across multiple regions. It uses technologies like content delivery networks (CDNs) and load balancers to cache and distribute traffic.
With these things in mind, theoretical root causes for the outage would include:
- CDN or caching issues—historical content that does not load (like posts) could be related to inaccessible cached content. Users who could still post and reply were possibly using functions that bypassed the CDN and reached backend services directly
- Database overloads—in some cases, the inability to load historical content could be due to heavy loads on databases, causing read failures
- Load balancer issues or network performance—poor distribution of traffic or other network issues could explain the variance in performance users reported
- Microservice failures: a possible explanation for the short duration of the user impact could be attributed to microservices that failed and did not auto-heal correctly and required manual intervention. Given that there are likely many backend containers running in any given region, it’s possible that only a subset of them were impacted.
Lessons to Learn
Given what we know and our outage analysis thought experiment, we’ve compiled our top three IT Ops and incident response lessons.
Lesson #1: “It works for me” doesn’t mean it’s working
If you’ve ever worked in IT support, you’ll know how easy it is to attribute user outage reports to PEBKAC (“Problem exists between keyboard and chair”) when a site works for you but not the person you’re supporting. X was generally available during the incident, so it’s easy to see how an overworked SysAdmin for a small site with a similar issue could have written off the initial reports as PEBKAC.
Website monitoring tools can help teams to double-check issues reported by users. For example, if a user reports a site is down—but it’s not down for you—check for increased latency, errors, or other performance issues from different regions. This may help you narrow down the problem.
Monitoring tools can help you avoid relying on user reports and respond to performance degradation early. For example, user activity monitoring helps teams detect errors impacting clients without needing a user-created ticket.
Lesson #2: Ping up != service up
We like ping. It is a simple, fast, and information-rich way to detect network-layer issues. However, problems like the X outage often exist at higher layers in the OSI model. For example, the network stack on a Linux system can respond to ping requests when a web service (such as Apache or NGINX) is entirely down. Adding checks for Layer 7 protocols like HTTP(S) and DNS can make your monitoring more robust. Techniques like transaction monitoring help teams ensure end-to-end user journeys work as expected.
Lesson #3: Don’t leave stakeholders guessing
Several users made assumptions about why the platform was down. Some of these assumptions were tied to their opinions about the platform’s owner, Elon Musk. It’s unclear, though, whether those assumptions were correct because users didn’t have clear information about what was happening.
Frankly, with a user base as large as X’s (over 600 million at the end of 2024), completely controlling a narrative or pointing everyone to the same source of truth is impractical. Nonetheless, IT can avoid ambiguity and confusion during a service incident by communicating clearly from a well-defined source of truth. For example, many platforms offer a public status page to inform stakeholders about known issues.
It’s worth noting that, at the time of writing, the Twitter (X) status page at https://twitter2.statuspage.io/ is active, while https://status.twitterstat.us/ is down.
Improve Site Monitoring and Incident Response with SolarWinds Pingdom
SolarWinds® Pingdom® is a simple and powerful website monitoring tool helping IT teams monitor website availability, performance, and user experience from multiple locations across the globe. With Pingdom, you can run various checks (including ping, HTTP, and DNS) to test site availability. You can also use transaction monitoring to ensure end-to-end user workflows are operational and to detect user issues directly with real user monitoring (RUM).
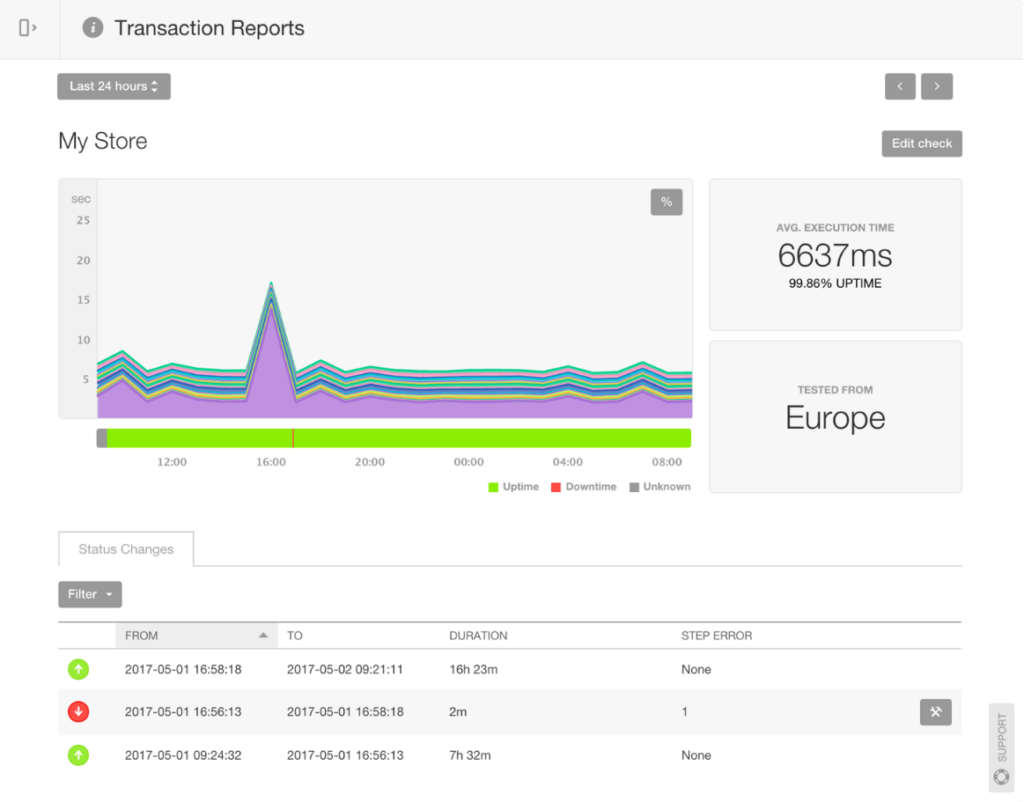
A transaction report as part of the holistic website monitoring in Pingdom.
If you’d like to try SolarWinds Pingdom yourself, sign up for a free (no credit card required) 30-day trial today.