
On Valentine’s Day (February 14), 2024, Facebook users in the US, UK, and Australia experienced heartbreak: The desktop version of Meta’s flagship social media platform went down for about an hour. The site recovered pretty quickly, though the social media giant didn’t release a postmortem as it did for the May 2023 Instagram outage. However, there is still plenty we can learn by examining the incident.
In this article, we’ll examine the details of the Facebook outage and explore three key lessons you can use to improve your team’s processes.
Scope of the outage
The Facebook outage began on February 14, 2024, at around 8:00 a.m. EST. Based on reports related to the outage, it lasted about 60-90 minutes and affected multiple regions. During the outage, reports indicate users saw a blank white screen when loading the Facebook website. Based on the data captured, the mobile app was mostly or entirely unaffected by the incident.
Thinking about the root cause
The lack of a postmortem or official statement from Meta means we can’t be sure about the outage’s root cause. However, we can still make inferences based on available data. Based on experience, these exercises can be more effective than reviewing a postmortem, especially when your team is trying to learn from an outage case study.
With that in mind, let’s consider some likely causes of this incident. We want to consider what might cause users worldwide to see a blank white page when loading a web app without impacting a mobile app.
Here is our list of the top three probable causes.
- Content delivery network (CDN) problems: CDNs help reduce latency and improve web application performance. If the CDN responsible for serving Facebook’s web app content had an issue, users could be stuck staring at a blank page.
- Deployment failures: Large-scale apps like Facebook are regularly updated, and Facebook engineering provided a deep dive into their rapid release cycle in 2017. Regular releases of code changes are certainly expected. Occasionally, one of those changes will fail. Typically, site reliability engineering (SRE) teams should catch those failures before end users see them; however, you might still encounter a similar situation in the real world.
- Backend service issues: If the web application leverages an API, database call, or other backend service the mobile app doesn’t, then a break in that dependency could lead to an outage.
What can we learn from the outage?
Now that we’ve examined the context and hypothetical root causes of Facebook’s outage, let’s consider three tips to improve website uptime and SRE processes.
Tip #1: Be proactive with performance monitoring.
Based on data derived from user reporting, this outage lasted about an hour. SRE and IT operations teams should strive to ensure that they discover—and respond to—incidents before they hear about them from end users. This requires proper monitoring and instrumentation.
For example, synthetic monitoring can allow teams to test website performance automatically, using a variety of scenarios and transaction steps. Monitoring tools will send an alert when a failure occurs. The benefit of these checks is that they go beyond simple up/down connectivity verification and can confirm the expected content loads on a page.
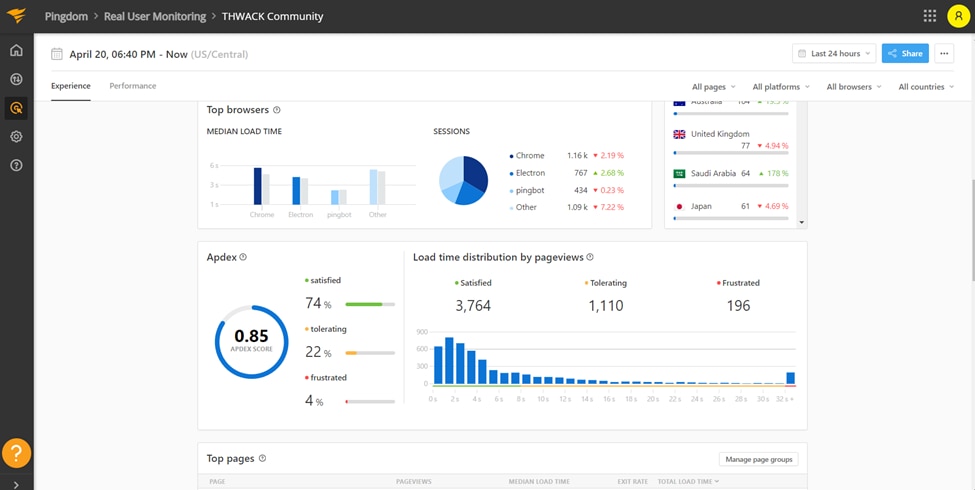
Real user monitoring (RUM) can also help teams identify minor issues before they become significant problems. For example, if a subset of users is experiencing errors or performance issues, RUM alerts can enable teams to respond before the impact widens.
Tip #2: Provide regular status updates to your users.
Although Meta provides a status page for its business products, it doesn’t offer much help for non-technical end users, like those affected by the Valentine’s Day outage. Frankly, with Facebook’s broad user base, a status page probably wouldn’t have prevented confusion or end users looking to social media for status updates. However, a status page can still be an excellent incident response tool for alignment and clarity when things go wrong.
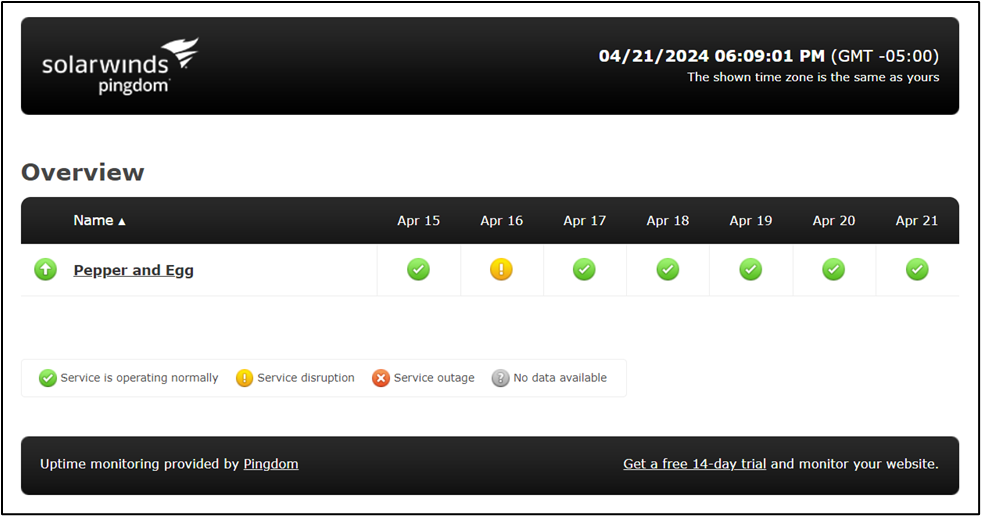
Whenever a service goes down, users typically try to figure out if the problem is them or the service. A user-facing status page makes determining service status easy, removing the guesswork from the situation. This could also reduce tech support calls, preventing your help desk from becoming flooded. A status page could be helpful to engineers who might be debugging a problem dependent on a down or degraded service.
If you want to make sure status pages do their job, you can:
- Ensure stakeholders know about the page. If people don’t know about the page, they’ll look elsewhere for a status update. Treating a status page like a source of truth and ensuring stakeholders know about it will reduce confusion among your users and the “noise” that engineers need to deal with during incident response.
- Publish pages with the “right” amount of detail. Status pages should provide enough detail so readers can understand what services are affected, the severity of the service degradation (such as a complete outage or a minor performance issue), and what to expect next. “Red, yellow, green” style indicators and a quick summary are typically enough to give stakeholders what they need. Avoid getting “in the weeds” and confusing users with information too technical to be meaningful to them.
- Keep pages up-to-date. For a status page to be a source of truth, it must accurately reflect service states. This means ensuring that you regularly update the page with the latest information and display all the services relevant to your stakeholders.
Tip #3: Reduce the blast radius.
The silver lining from the Facebook outage, if there was one, is that mobile users seemed unaffected. Whether or not that resulted from an intentional action taken by Meta engineers, we can’t say. However, by taking steps to reduce the blast radius of potential incidents, teams can minimize the risk that an incident in a single service will take out an entire system.
For example, canary releases and blue/green deployments are proven strategies for managing risk in production changes. Similarly, a microservices architecture that embraces loose coupling helps reduce the risk of an issue in one component (microservice) bringing down another.
How Pingdom can help
SolarWinds® Pingdom® is a simple but powerful website monitoring platform designed to help teams detect and solve web application issues quickly. Teams can use Pingdom to monitor their application from over 100 locations using a variety of “checks” to validate performance and trigger alerts if something goes wrong.
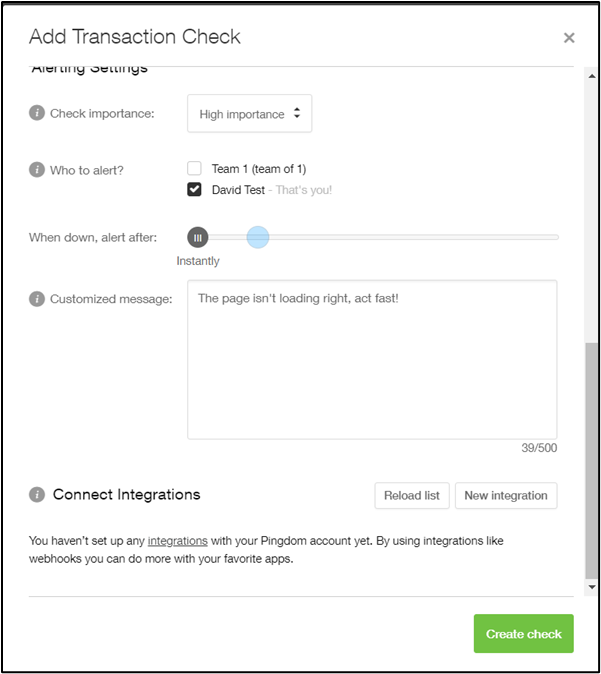
As an example, this Pingdom check is designed to catch a failure similar to the Facebook outage:
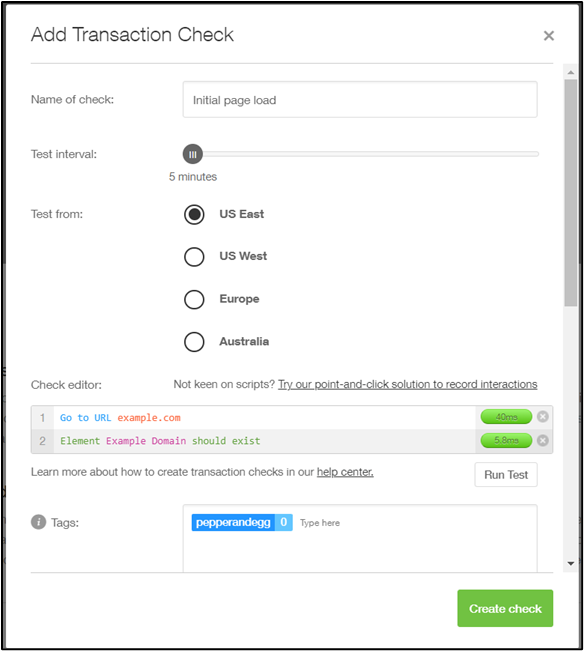
The check loads example.com and checks for the presence of an Example Domain element. If the page is working correctly, then the check will pass.
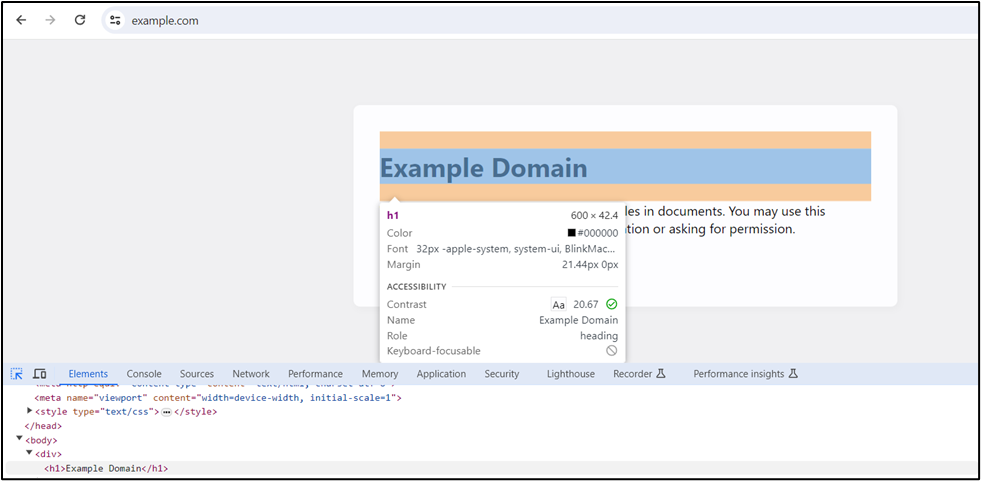
If the check fails, an alert can notify the right people to solve the problem. Integrations or webhooks can help automate the incident response process.
If you’d like to take Pingdom for a test drive, claim your free (no credit card required) 30-day trial today!