We have pointed out China’s amazing potential before on this blog, and we have also made detailed comparisons between China and the USA.
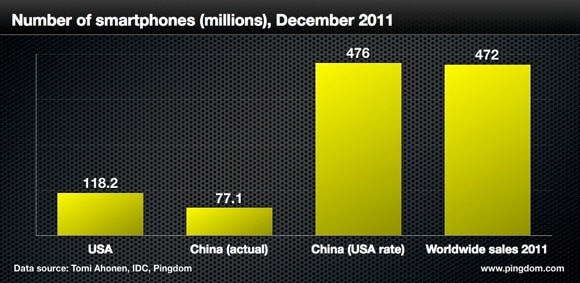
But with over 1.3 billion people, China has “only” 77 million smartphones, which, per capita, is far behind many other countries around the world, including the USA.
So let’s be honest, haven’t you wondered what if China had the same number of smartphones per capita as the USA?
Let’s play a game of “what if.”
Comparing two giants
We pick the USA again as a measuring stick because it has the largest number of smartphones of any country in the world. But that may not last very long though.
According to Strategy Analytics, China has already bypassed the USA as the number one smartphone market in terms of shipments. The company reported 23.9 million smartphones sold in China in Q3 2011 compared to 23 million smartphones sold in the USA during the same period.
Smartphone penetration
In December 2011, Tomi Ahonen published a list of countries and their respective smartphone penetration. We will use this list for most of the numbers in the remainder of this article.
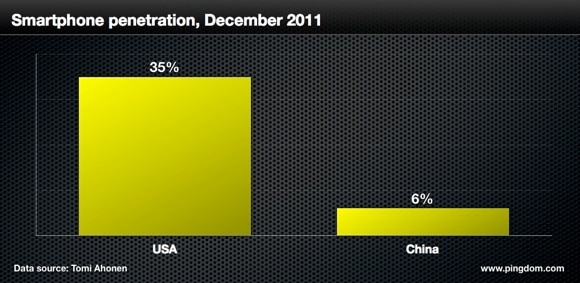
According to Ahonen’s numbers, Singapore is the country with the highest per capita smartphone ownership with rate of 90%. USA is tied for position 16 with Greece, Ireland and Portugal. The smartphone penetration in these countries is 35%.
China comes in at a distant 41st place, with only 6% smartphone penetration. So, for smartphone penetration, we get this situation:

Where it gets interesting, is if we look at the real number of smartphones in each country, and apply the smartphone penetration rate in the USA to China (meaning if China had 35% smartphone penetration, like the USA). Now the situation changes quite dramatically. And if we add in the estimated sales of smartphones worldwide in 2011, this is what it looks like:

Smartphone data usage
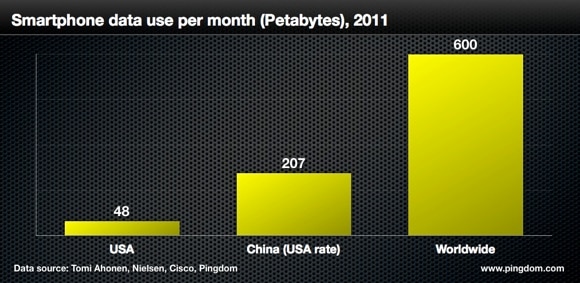
According to Nielsen, the average smartphone owner in the USA used up 435 MB of mobile data per month in Q1 2011. On aggregate, that means that in the USA smartphone users consumed 48 PB per month. If we again toy with the idea that China has the same smartphone penetration as the USA, Chinese smartphone users would use up 207 PB during the same time period.

Cisco forecast that the worldwide consumption of mobile data per month would land at 600 PB in 2011. Note that Cisco’s figure is not particular to smartphones, but we think the numbers are nonetheless interesting to compare.
The reality may be even more amazing
This was of course just a thought experiment, but don’t be surprised if reality turns out to be even more amazing. And this was just a look at two countries, so what would it look like if we included some other big markets, like Brazil and India?
One thing is for sure, and that is that everything in mobile telecommunications seems to be moving at breakneck speed. We showed you recently how fast the world’s population has taken to mobile technology. This “what if scenario” only reinforces how different the mobile world is from so many other technologies that have come before it.
Photo of the flags by futureatlas.


