 Yesterday we released a big, brand new report about social network site uptime in 2008.
Included in the report are Facebook, MySpace, LinkedIn, Twitter, Friendster, LiveJournal, Orkut, Bebo, Hi5, Windows Live Spaces, Last.fm, Classmates.com, Reunion.com, Xanga and Imeem.
The full report is available as a free PDF, but we have lifted out some interesting data from the report here below.
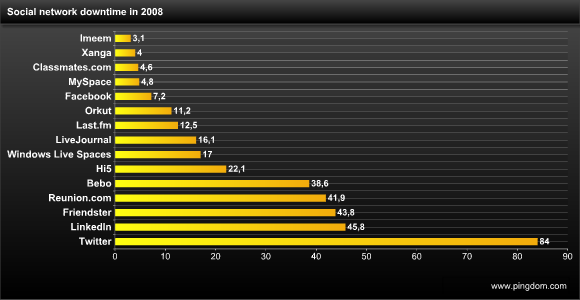
Downtime per social network in 2008
This is a summary of the accumulated downtime in 2008 for each of the 15 social networks included in this survey.

* Note that Imeem was not added for monitoring until May 9, 2008 and thus has incomplete data.
Key findings
While there is far more data to look at in the report, these were some of the standout facts and trends in social network site availability in 2008:
- Only 5 social networks managed an overall uptime of 99.9% or better: Facebook (99.92%), MySpace (99.94%), Classmates.com (99.95%), Xanga (99.95%) and Imeem (99.95%). Again, it should be pointed out that Imeem was only monitored from May 9 and onward while the other sites were monitored the entire year.
- The single most massive social network incident in 2008 happened to Friendster. The service had a data center outage in November that caused more than 23 hours of downtime in a time span of less than 3 days. If it weren’t for that incident, Friendster would have placed much better in this survey.
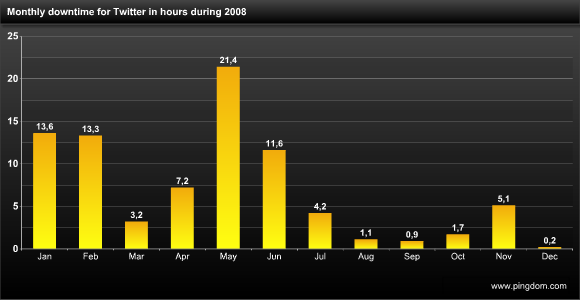
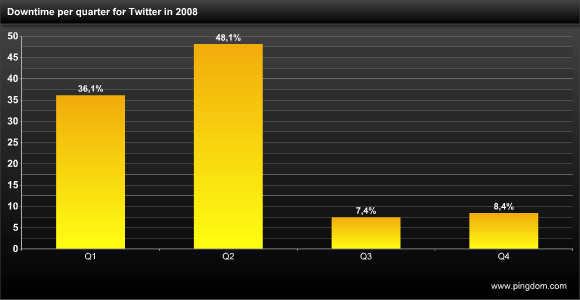
- 84% of Twitter’s downtime happened during the first half of 2008. July and onward has seen a big improvement in site availability for Twitter.
- 77% of LiveJournal’s downtime happened in Q4 of 2008. It is too early to say if this is indicative of a trend or if it was a temporary lapse in uptime due to the service’s migration to a new hosting provider.
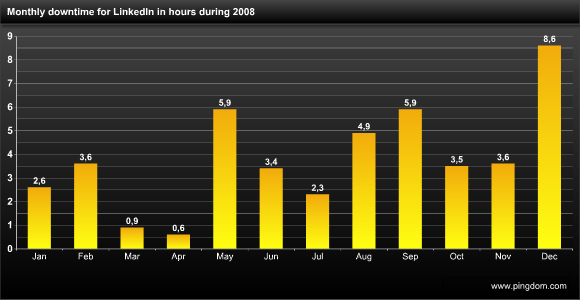
- LinkedIn’s downtime has been increasing over the year. Each quarter has seen a larger amount of downtime than the one before it.
A closer look at the trends for Twitter and LinkedIn
The full report has a monthly breakdown for each of the 15 social networks, but here we will only look at the data for two, Twitter and LinkedIn, since they ended up with the most downtime in 2008 out of the ones included in the survey.
Twitter has turned the trend
Twitter may have ended up with the most downtime in this survey, but as we pointed out above, its site availability has improved significantly in the second half of 2008. Nothing illustrates Twitter’s improvement better than looking at its downtime month by month, and how much of its overall yearly downtime took place each quarter.


LinkedIn’s downward trend
LinkedIn’s situation seems to be almost the opposite of Twitter’s. Its downtime has been increasing gradually, which is easy to see when you look at the breakdown of the results shown here below.


TechCrunch reported last weekend that LinkedIn has been, and is still, growing fast. It could be that LinkedIn is suffering from scaling problems due its growing user base, a question we raised back in October of 2008.
Check out the full report for MUCH more info
What we included here was just a small part of what is available in the full report. The PDF report is free, and we encourage you to spread it and share it with others.
The full report answers additional questions such as:
- Which was the longest continuous outage for each social network in 2008?
- How much downtime did each social network have each month?
- The downtime trend for each social network. Is stability getting better or worse?
- Why is high availability so important to social networks?
The report, including graphs, key findings and additional analysis is available here (as a PDF file):


