SolarWinds® Pingdom® and SolarWinds AppOptics™ are two products used for monitoring web applications. If both of these products monitor web applications, why would someone want to use them together? This blog post answers that question.
At a high level, Pingdom monitors your application from the outside looking in, similar to how your users experience it, and AppOptics completes the picture with server-side visibility. Let’s take a closer look at these products individually to get a better understanding of what they do.
Pingdom
Pingdom provides four different methods to monitor your web applications.
Uptime Monitoring
Pingdom will open a web page or API endpoint from an automated browser up to once a minute, and inform you if that web page is alive and working properly (no HTTP errors, responded within a threshold).
Synthetic Transaction Testing
Think of this as a robot sitting behind a browser and emulating some of your site’s most critical transactions at a set interval. If the transaction involves logging into a site, choosing some items, and proceeding to checkout, Pingdom will alert you if any of those steps fail.
Real User Monitoring (RUM)
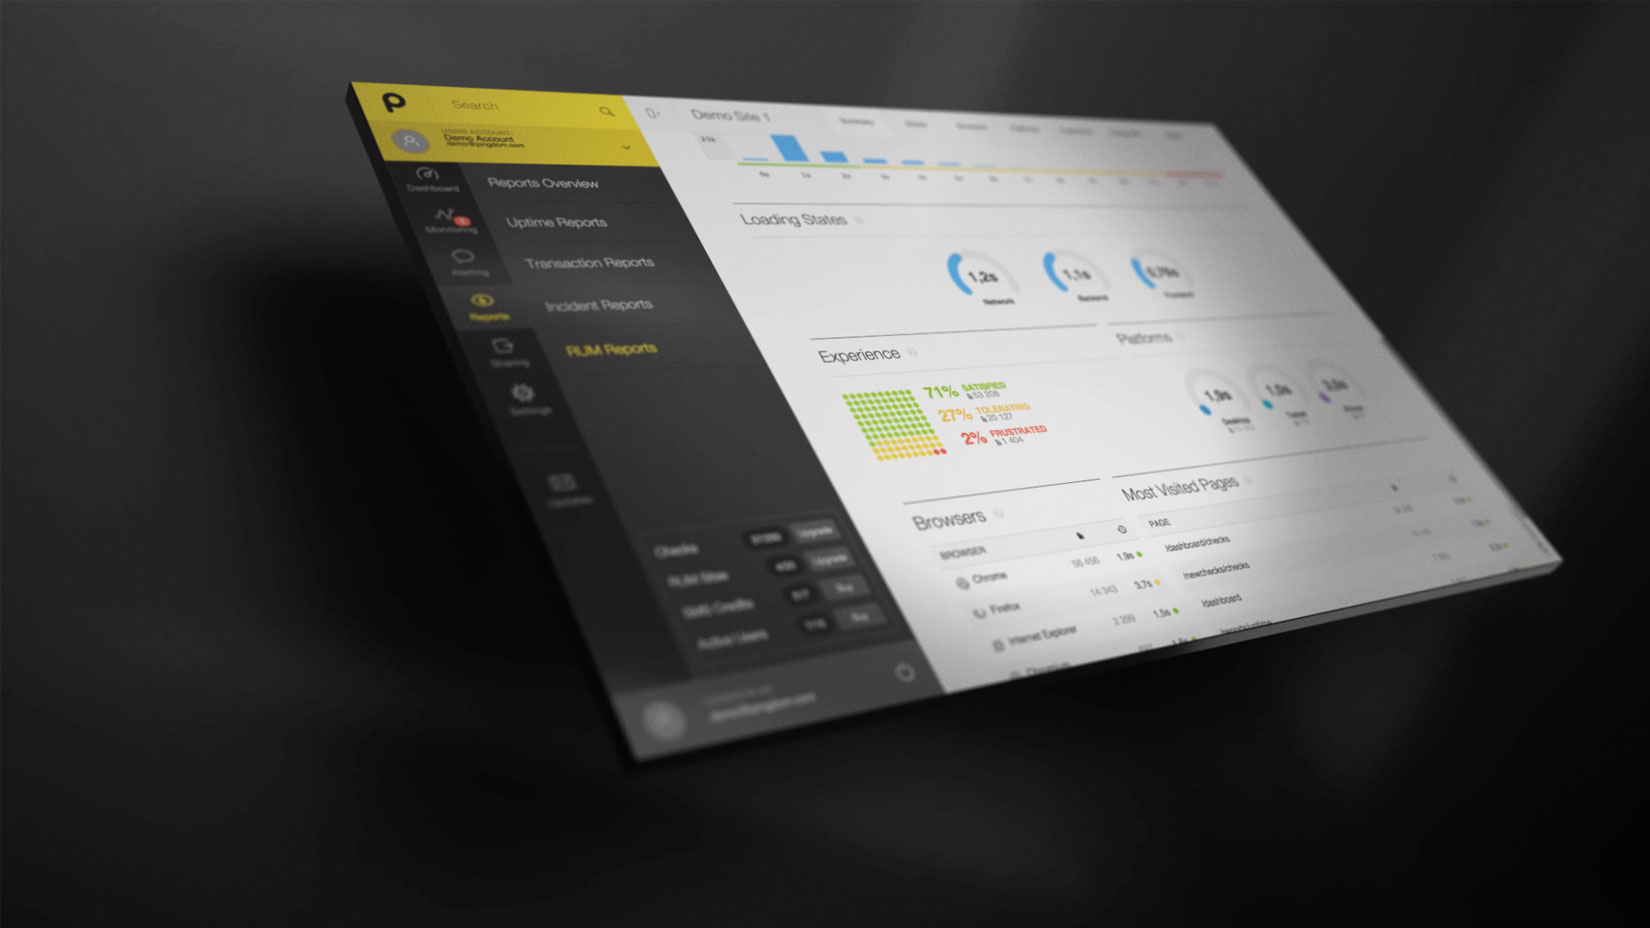
RUM measures the performance of real users, providing actionable data such as load times by geographic area, types of devices, and which browsers are being used to access the site. RUM completes the outside-in view by including what the actual user’s experience is with your web application.
Page Speed Monitoring
This is load time of a web page broken down by individual components such as images, scripts, and CSS assets.
The one thing that these four components have in common is that they all provide data from the outside looking in. If your web application goes down and users are unable to access it, Pingdom will notify you that it’s down (or slow).
AppOptics
Complementary to what we just looked at in Pingdom, AppOptics monitors applications from an internal perspective. Just as we did before, let’s take a look at one of the components to get a better understanding.
APM
APM stands for application performance monitoring and provides code-level visibility into an application. When an application is slow, AppOptics can tell you why. For example, when someone tries to log in to your website, the application might wait for two seconds on a specific query to a database. AppOptics can tell you exactly how long the application is waiting on the database and even the query that was made. Put a different way, when Pingdom tells you the application is slow (or down), AppOptics can tell you why it’s slow (or down).

Infrastructure
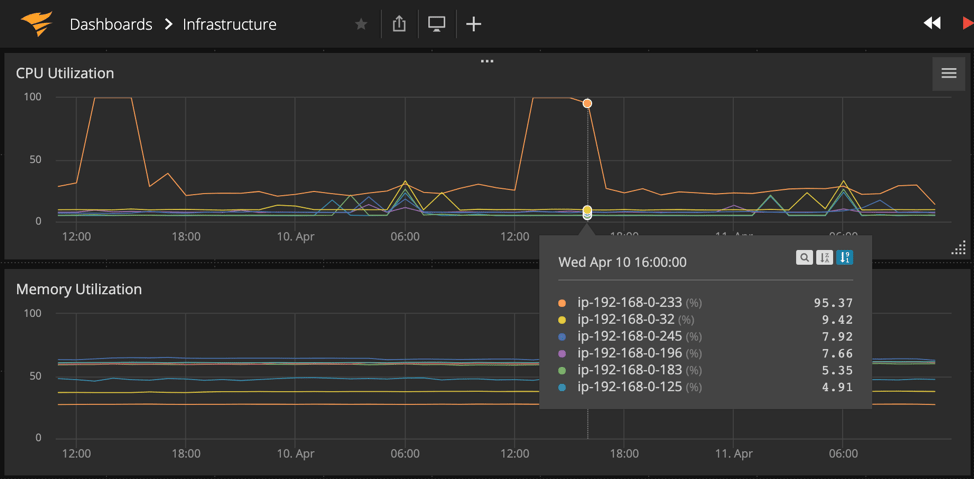
AppOptics infrastructure capabilities help you monitor metrics such as CPU. Memory and disk utilization. This feature enables you to catch resource issues and fix them before they turn into failed uptime checks.

Better Together
Now that we have a rough idea of how each of these products works, how could we use them together? Let’s use a simple example.
You are responsible for the availability of a website, and that website just started serving nothing but HTTP 500 errors. From the user’s perspective, the website is unavailable, and as long as you have an uptime check setup in Pingdom, you already know.
Pingdom will alert you that the application is down and provide the error code, but it doesn’t tell you why you got that error or why the site is down. Instead of guessing why the application is down, AppOptics can tell you. AppOptics will show you the server-side transaction that is causing the 500 error, providing context to understand what the problem is, and who needs to fix it. Whether it’s a developer issue and someone needs to change the code, or the infrastructure running the application has run out of resources, AppOptics removes the guesswork and lets you resolve the issue faster.
If you are interested in learning more about AppOptics, try it free for 14 days. If you aren’t already using Pingdom, you can also try it free for 14 days.


