JPG, PNG and GIF are the three image formats that websites use for their images. We decided to find out exactly how common each format is, and how large the images of each format tend to be. After analyzing more than 23 million images, we have found some very interesting results.
To be able to perform this analysis properly we needed a large sample base, and fortunately we have one. We have gone through more than half a million saved tests from the Pingdom Full Page Test (it’s a free tool for analyzing content and load times of Web pages). The tested pages together contain the 23+ million images that were the basis of this survey.
We will answer the following questions:
- How common are the different image formats?
- How much do images contribute to page size?
- How large are the images of the different formats?
(When we refer to “images on the Web” in this article, we are refering to the image usage on websites.)
First a few quick observation and conclusions…
Interesting observations
We will dive deeper into the facts further down, but these are some observations that we have picked out from the information gathered in this article.
- GIF images are the most common, making up 54.7% of all images on the Web.
- PNG images are the least common, making up only 14.4% of all images.
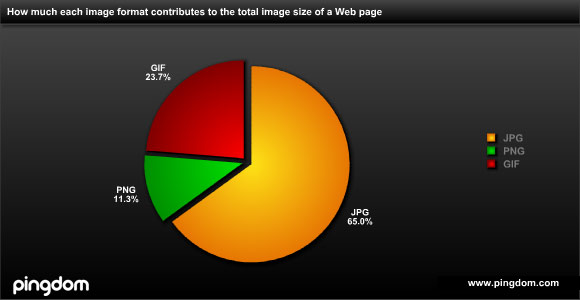
- JPG images contribute the most to page size, even though they make up less than one third of the images.
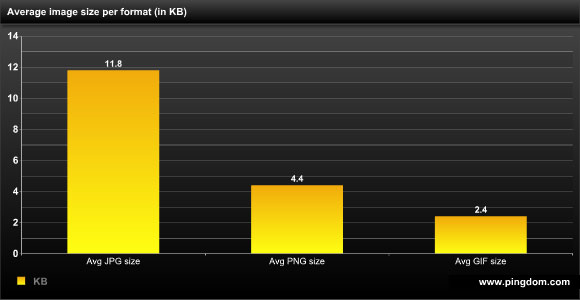
- Average image size per format: JPG: 11.8 KB, PNG: 4.4 KB, GIF: 2.4 KB.
- There are 42.8 images per Web page on average.
- Images contribute to 61.3% of the download size of a Web page on average.
- There is an average of 240 KB of images on each web page.
This was just brief summary. Read on to get to the details.
GIF by far the most common format
Since we have used such a large sample base, the numbers in this survey are very close approximations of the overall use of images on the entire Web.
For the images on the Web, this is how common the various formats are:
- JPG: 30.9%
- PNG: 14.4%
- GIF: 54.7%
Note how GIF holds a larger share than the other two formats combined.

We have to admit that at first we were a bit surprised by the results. We expected PNG images to be more common than this.
However, when thinking about it, GIFs are frequently used for design elements and icons, which result in many (and small) images. The intended transition from GIF to PNG obviously still has some way to go.
Image contribution to page size
This survey found that a Web page will have, on average, 42.8 images. These images will constitute 61.3% of the download size of the Web page. This last number is consistent with a survey about the load size of the top 100 blogs that we did a few weeks ago (which amazingly enough landed on this exact number for images’ contribution to page size).
But even though more than half of the images are GIF images (on average), JPG files contribute much more to the total download size. They are fewer, but significantly larger on average.
This is how much the different formats make up of the size of the images (size in bytes, not dimensions) on a Web page:
- JPG: 65.0%
- PNG: 11.3%
- GIF: 23.7%
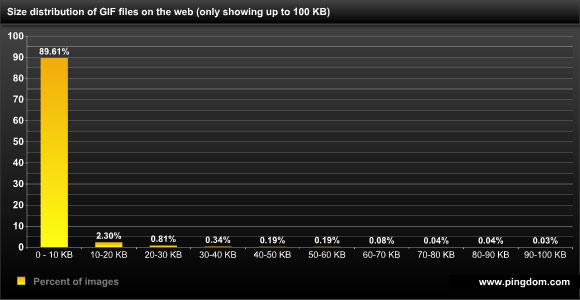
GIF image usage on the Web
- Average number of GIF images per Web page: 23.4
- Average size of a GIF image: 2.4 KB
- 89.6% of the GIF images are smaller than 10 KB.
- 93.6% of the GIF images are smaller than 100 KB.
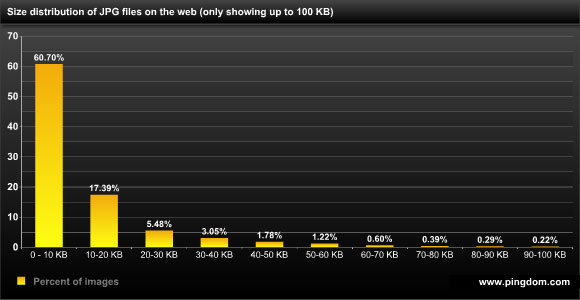
JPG image usage on the Web
- Average number of JPG images per Web page: 13.2
- Average size: 11.8 KB
- 60.7% are smaller than 10 KB.
- 91.1% are smaller than 100 KB.
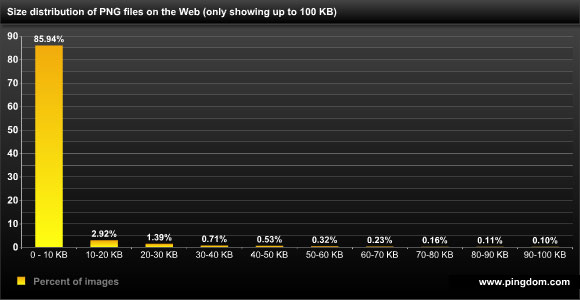
PNG image usage on the Web
- Average number of PNG images per Web page: 6.2
- Average size of a PNG image: 4.4 KB
- 85.9% of the PNG images are smaller than 10 KB.
- 92.4% of the PNG images are smaller than 100 KB.
Conclusion
It is always interesting to get the actual facts of a situation and being able to look at statistics from a large sample base like this. Though some of the results were expected, there were some surprises in there as well (at least for us!).
We can now say for sure what the overall situation for image use actually looks like on the Web. We hope you found this report interesting.
If you build websites, how do you use images when you build your sites? What do you use the different image formats for? Do you still use GIFs? Do you shun PNGs for some reason? HOW do you use these different formats?
We’re very interested in hearing your perspective(s) on this, so please don’t hesitate to comment.


