There is so much happening on the Internet during a year that it’s impossible to capture it all in a blog post, but we’re going to give it a shot anyway. How many emails were sent during 2012? How many domains are there? What’s the most popular web browser? How many Internet users are there? These are some of the questions we’ll answer for you.
To bring you these answers, we’ve gone to the ends of the web – wherever that is – and back again, and compiled a list of truly fascinating facts about the year that was. Some of the numbers are snapshots taken during the year, others cover the entire period. Either way, they all contribute to giving us a better understanding of Internet in 2012. Enjoy!
- 2.2 billion – Number of email users worldwide.
- 144 billion – Total email traffic per day worldwide.
- 61% – Share of emails that were considered non-essential.
- 4.3 billion – Number of email clients worldwide in 2012.
- 35.6% – Usage share of the most popular email client, which was Mail for iOS.
- 425 million – Number of active Gmail users globally, making it the leading email provider worldwide.
- 68.8% – Percentage of all email traffic that was spam.
- 50.76% – Percentage of all spam that was about pharmaceuticals, the top category of all spam.
- 0.22% – Share of worldwide emails that comprised some form of phishing attack.
Web pages, websites, and web hosting
- 634 million – Number of websites (December).
- 51 million – Number of websites added during the year.
- 43% – Share of the top 1 million websites that are hosted in the U.S.
- 48% – Share of the the top 100 blogs that run WordPress.
- 75% – Share of the top 10,000 websites that are served by open source software.
- 87.8 million – Number of Tumblr blogs.
- 17.8 billion – Number of page views for Tumblr.
- 59.4 million – Number of WordPress sites around the world.
- 3.5 billion – Number of webpages run by WordPress viewed each month.
- 37 billion – Number of pageviews for Reddit.com in 2012.
- 35% – The average web page became this much larger during 2012.
- 4% – The average web page became this much slower to load during 2012.
- 191 million – Number of visitors to Google Sites, the number 1 web property in the U.S. in November.
Web servers
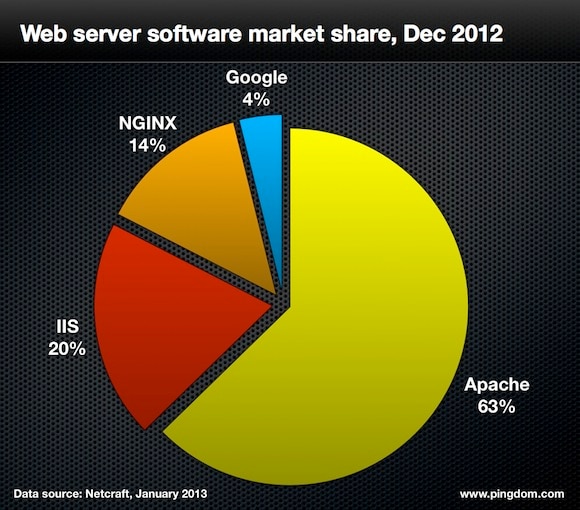
- -6.7% – Decline in the number of Apache websites in 2012.
- 32.4% – Growth in the number of IIS websites in 2012.
- 36.4% – Growth in the number of NGINX websites in 2012.
- 15.9% – Growth in the number of Google websites in 2012.
Domain names
- 246 million – Number of domain name registrations across all top-level domains.
- 104.9 million – Number of country code top-level domain name registrations.
- 329 – Number of top level domains.
- 100 million – Number of .com domain names at the end of 2012.
- 14.1 million – Number of .net domain names at the end of 2012.
- 9.7 million – Number of .org domain names at the end of 2012.
- 6.7 million – Number of .info domain names at the end of 2012.
- 2.2 million – Number of .biz domain names at the end of 2012.
- 32.44% – Market share for GoDaddy.com, the biggest domain name registrar in the world.
- $2.45 million – The price for Investing.com, the most expensive domain name sold in 2012.
Internet users
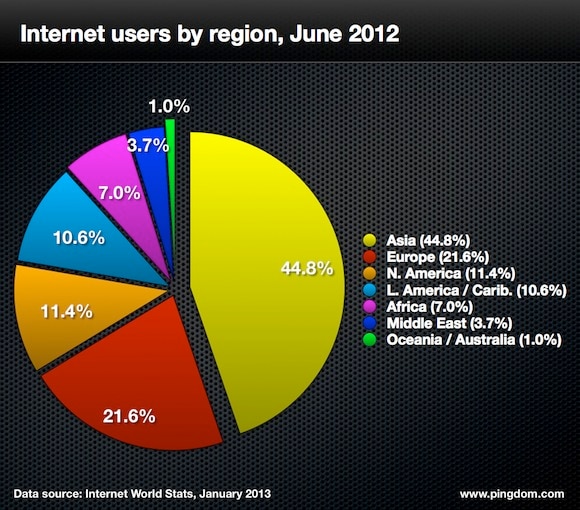
- 2.4 billion – Number of Internet users worldwide.
- 1.1 billion – Number of Internet users in Asia.
- 519 million – Number of Internet users in Europe.
- 274 million – Number of Internet users in North America.
- 255 million – Number of Internet users in Latin America / Caribbean.
- 167 million – Number of Internet users in Africa.
- 90 million – Number of Internet users in the Middle East.
- 24.3 million – Number of Internet users in Oceania / Australia.
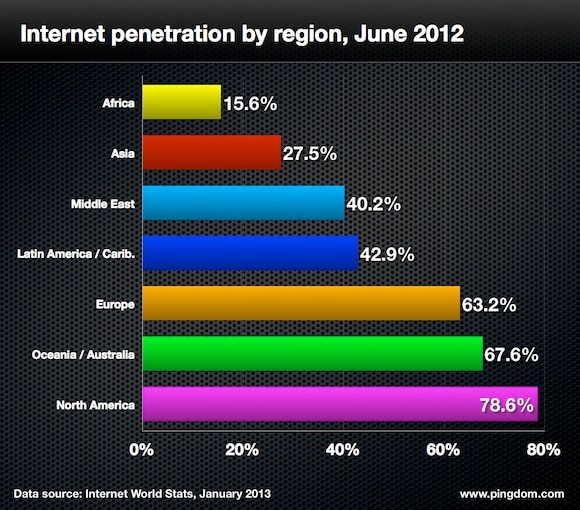
- 565 million – Number of Internet users in China, more than any other country in the world.
- 42.1% – Internet penetration in China.
Social media
- 85,962 – Number of monthly posts by Facebook Pages in Brazil, making it the most active country on Facebook.
- 1 billion – Number of monthly active users on Facebook, passed in October.
- 47% – Percentage of Facebook users that are female.
- 40.5 years – Average age of a Facebook user.
- 2.7 billion – Number of likes on Facebook every day.
- 24.3% – Share of the top 10,000 websites that have Facebook integration.
- 200 million – Monthly active users on Twitter, passed in December.
- 819,000+ – Number of retweets of Barack Obama’s tweet “Four more years”, the most retweets ever.
- 327,452 – Number of tweets per minute when Barack Obama was re-elected, the most ever.
- 729,571 – Number of messages per minute when the Chinese microblogging service Sina Weibo saw 2012 finish and 2013 start.
- 9.66 million – Number of tweets during the opening ceremony of the London 2012 olympics.
- 175 million – Average number of tweets sent every day throughout 2012.
- 37.3 years – Average age of a Twitter user.
- 307 – Number of tweets by the average Twitter user.
- 51 – Average number of followers per Twitter user.
- 163 billion – the number of tweets since Twitter started, passed in July.
- 123 – Number of heads of state that have a Twitter account.
- 187 million – Number of members on LinkedIn (September).
- 44.2 years – Average age of a Linkedin user.
- 135 million – Number of monthly active users on Google+.
- 5 billion – How many times per day the +1 button on Google+ is used.
- 20.8% – Usage share of HootSuite as a social media management tool among the world’s top 100 brands.
Web browsers
Search
- 1.2 trillion – Number of searches on Google in 2012.
- 67% – Google’s market-leading share of the U.S. search market (December).
- 1 – The top trending question of the year on Ask.com: “Will Rob and Kristen get back together?”
Mobile
- 1.1 billion – Number of global smartphone subscribers.
- 6.7 billion – Number of mobile subscriptions.
- 5 billion – Number of mobile phone users.
- 5.3 billion – Number of mobile handsets.
- 1.3 billion – Number of smartphones in use worldwide by end of 2012.
- 465 million – Number of Android smartphones sold in 2012, a 66% market share.
- 31% – Percentage of the U.S. Internet population that used a tablet or e-reader.
- 13% – Mobile share of global Internet traffic.
- 5 billion – Number of mobile broadband subscriptions.
- 1.3 exabytes – Estimated global mobile data traffic per month in 2012.
- 59% – Share of global mobile data traffic that was video.
- 500 megabytes – Amount of monthly data traffic consumed by the average smartphone.
- 504 kbps – The average mobile network connection speed globally (all handsets).
- 1,820 kbps – The average mobile network connection speed globally (smartphones).
Video
- 14 million – Number of Vimeo users.
- 200 petabytes – Amount of video played on Vimeo during 2012.
- 150,648,303 – Number of unique visitors for video to Google Sites, the number one video property (September).
- 1 billion – PSY’s Gangnam Style video became the first online video to reach 1 billion views (currently just over 1.1 billion) and it achieved it in just 5 months.
- 2.7 billion – Number of views of videos uploaded to YouTube tagged Obama or Romney during the 2012 U.S. election cycle
- 2.5 million – Number of hours of news-related video that was uploaded to YouTube.
- 8 million – The number of concurrent viewers of the lifestream of Felix Baumgartner’s jump from the edge of space, the most ever on YouTube.
- 4 billion – Number of hours of video we watched on YouTube per month.
- 60 million – Number of global viewers monthly on Ustream.
- 16.8 million – Number of total viewers in a 24 hour period for a video on Ustream, the most ever.
- 181.7 million – Number of total unique viewers of online video in the U.S. during December.
Images
- 7 petabytes – How much photo content Facebook added every month.
- 300 million – Number of new photos added every day to Facebook.
- 5 billion – The total number of photos uploaded to Instagram since its start, reached in September 2012.
- 58 – Number of photos uploaded every second to Instagram.
- 1 – Apple iPhone 4S was the most popular camera on Flickr.
What about the Internet in 2013?
Just a couple of weeks into 2013 we don’t yet know much about what the year ahead has in store for us. However, we can perhaps make a few predictions: we will be accessing the Internet more with mobile devices, social media will play an increasingly important role in our lives, and we’ll rely even more on the Internet both privately as well as professionally.
We will be back again early next year to wrap up 2013. In the meantime, you may also want to check out our annual summaries for 2008, 2009, 2010, and 2011.


