So what happened with the Internet in 2011? How many email accounts were there in the world in 2011? How many websites? How much did the most expensive domain name cost? How many photos were hosted on Facebook? How many videos were viewed to YouTube?
We’ve got answers to these questions and many more. A veritable smorgasbord of numbers, statistics and data lies in front of you. Using a variety of sources we’ve compiled what we think are some of the more interesting numbers that describe the Internet in 2011.
- 3.146 billion – Number of email accounts worldwide.
- 27.6% – Microsoft Outlook was the most popular email client.
- 19% – Percentage of spam emails delivered to corporate email inboxes despite spam filters.
- 112 – Number of emails sent and received per day by the average corporate user.
- 71% – Percentage of worldwide email traffic that was spam (November 2011).
- 360 million – Total number of Hotmail users (largest email service in the world).
- $44.25 – The estimated return on $1 invested in email marketing in 2011.
- 40 – Years since the first email was sent, in 1971.
- 0.39% – Percentage of email that was malicious (November 2011).
Websites
- 555 million – Number of websites (December 2011).
- 300 million – Added websites in 2011.
Web servers
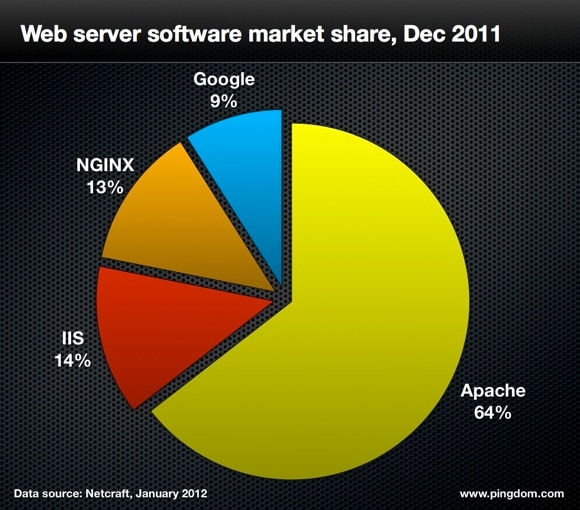
- 239.1% – Growth in the number of Apache websites in 2011.
- 68.7% – Growth in the number of IIS websites in 2011.
- 34.4% – Growth in the number of NGINX websites in 2011.
- 80.9% – Growth in the number of Google websites in 2011.

Domain names
- 95.5 million – Number of .com domain names at the end of 2011.
- 13.8 million – Number of .net domain names at the end of 2011.
- 9.3 million – Number of .org domains names at the end of 2011.
- 7.6 million – Number of .info domain names at the end of 2011.
- 2.1 million – Number of .biz domain names at the end of 2011.
- 220 million – Number of registered domain names (Q3, 2011).
- 86.9 million – Number of country code top-level domains (.CN, .UK, .DE, etc.) (Q3, 2011).
- 324 – Number of top-level domains.
- 28% – Market share for BIND, the number one DNS server type.
- $2.6 million – The price for social.com, the most expensive domain name sold in 2011.
Internet users
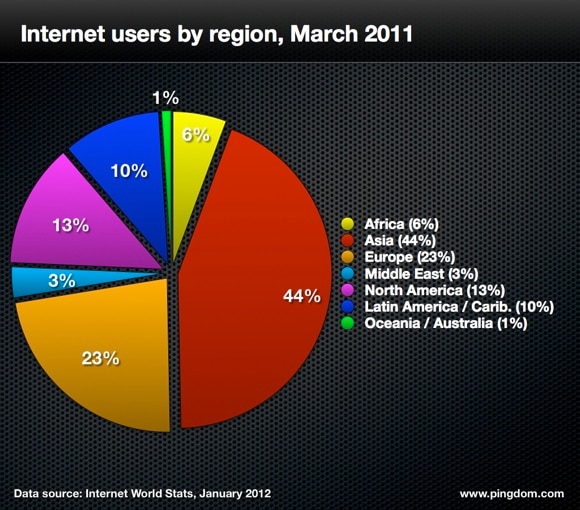
- 2.1 billion – Internet users worldwide.
- 922.2 million – Internet users in Asia.
- 476.2 million – Internet users in Europe.
- 271.1 million – Internet users in North America.
- 215.9 million – Internet users in Latin America / Caribbean.
- 118.6 million – Internet users in Africa.
- 68.6 million – Internet users in the Middle East.
- 21.3 million – Internet users in Oceania / Australia.
- 45% – Share of Internet users under the age of 25.
- 485 million – Number of Internet users in China, more than any other country in the world.
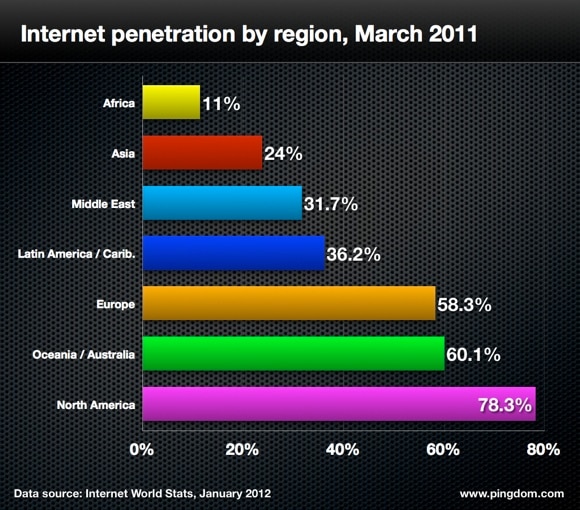
- 36.3% – Internet penetration in China.
- 591 million – Number of fixed (wired) broadband subscriptions worldwide.


Social media
- 800+ million – Number of users on Facebook by the end of 2011.
- 200 million – Number of users added to Facebook during 2011.
- 350 million – Number of Facebook users that log in to the service using their mobile phone.
- 225 million – Number of Twitter accounts.
- 100 million – Number of active Twitter users in 2011.
- 18.1 million – People following Lady Gaga. Twitter’s most popular user.
- 250 million – Number of tweets per day (October 2011).
- 1 – #egypt was the number one hashtag on Twitter.
- 8,868 – Number of tweets per second in August for the MTV Video Music Awards.
- $50,000 – The amount raised for charity by the most retweeted tweet of 2011.
- 39 million – The number of Tumblr blogs by the end of 2011.
- 70 million – Total number of WordPress blogs by the end of 2011.
- 1 billion – The number of messages sent with WhatsApp during one day (October 2011).
- 2.6 billion – Worldwide IM accounts.
- 2.4 billion – Social networking accounts worldwide.
Web browsers
Mobile
- 1.2 billion – The number of active mobile broadband subscriptions worldwide in 2011.
- 5.9 billion – The estimated number of mobile subscriptions worldwide in 2011.
- 85% – Percentage of handsets shipped globally in 2011 that included a web browser.
- 88% – Apple iPad’s share of global tablet web traffic in December.
Videos
- 1 trillion – The number of video playbacks on YouTube.
- 140 – The number of YouTube video playbacks per person on Earth.
- 48 hours – The amount of video uploaded to YouTube every minute.
- 1 – The most viewed video on YouTube during 2011 was Rebecka Black’s “Friday.”
- 82.5% – Percentage of the U.S. Internet audience that viewed video online.
- 76.4% – YouTube’s share of the U.S. video website market (December 2011).
- 4,189,214 – Number of new users on Vimeo.
- 201.4 billion – Number of videos viewed online per month (October 2011).
- 88.3 billion – Videos viewed per month on Google sites, incl. YouTube (October 2011).
- 43% – Share of all worldwide video views delivered by Google sites, incl. YouTube.
Images
- 14 million – Number of Instagram accounts created during 2011.
- 60 – The average number of photos uploaded per second to Instagram.
- 100 billion – Estimated number of photos on Facebook by mid-2011.
- 51 million – Total number of registered users on Flickr.
- 4.5 million – Number of photos uploaded to Flickr each day.
- 6 billion – Photos hosted on Flickr (August 2011).
- 1 – Apple iPhone 4 is the most popular camera on Flickr.
What’s in store for 2012?
For 2012, there’s every reason to think that the Internet, by any measure, will keep growing. As we put more of our personal as well as professional lives online, we will come to rely on the Internet in ways we could hardly imagine before. For better or worse, the Internet is now a critical component in almost everything we do.
We will be back again early next year to wrap up 2012. In the meantime, you may also want to check out our annual summaries for 2008, 2009, and 2010.


