What happened with the Internet in 2009?
How many websites were added? How many emails were sent? How many Internet users were there? This post will answer all of those questions and many more. Prepare for information overload, but in a good way. 😉
We have used a wide variety of sources from around the Web. A full list of source references is available at the bottom of the post for those interested. We here at Pingdom also did some additional calculations to get even more numbers to show you.
Enjoy!
- 90 trillion – The number of emails sent on the Internet in 2009.
- 247 billion – Average number of email messages per day.
- 1.4 billion – The number of email users worldwide.
- 100 million – New email users since the year before.
- 81% – The percentage of emails that were spam.
- 92% – Peak spam levels late in the year.
- 24% – Increase in spam since last year.
- 200 billion – The number of spam emails per day (assuming 81% are spam).
Websites
- 234 million – The number of websites as of December 2009.
- 47 million – Added websites in 2009.
Web servers
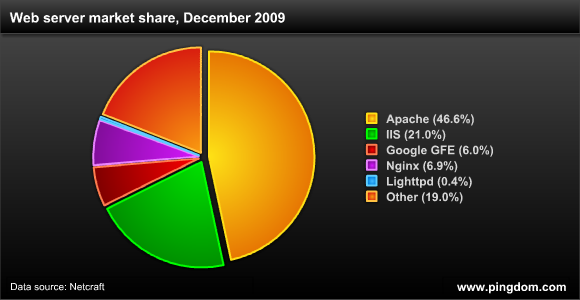
- 13.9% – The growth of Apache websites in 2009.
- -22.1% – The growth of IIS websites in 2009.
- 35.0% – The growth of Google GFE websites in 2009.
- 384.4% – The growth of Nginx websites in 2009.
- -72.4% – The growth of Lighttpd websites in 2009.

Domain names
- 81.8 million – .COM domain names at the end of 2009.
- 12.3 million – .NET domain names at the end of 2009.
- 7.8 million – .ORG domain names at the end of 2009.
- 76.3 million – The number of country code top-level domains (e.g. .CN, .UK, .DE, etc.).
- 187 million – The number of domain names across all top-level domains (October 2009).
- 8% – The increase in domain names since the year before.
Internet users
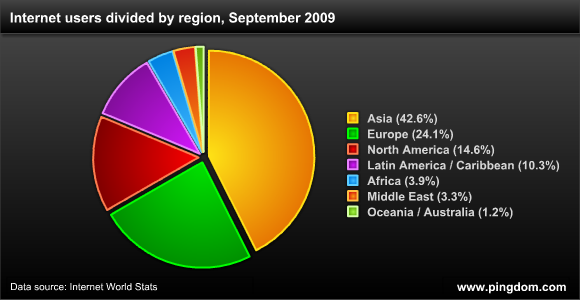
- 1.73 billion – Internet users worldwide (September 2009).
- 18% – Increase in Internet users since the previous year.
- 738,257,230 – Internet users in Asia.
- 418,029,796 – Internet users in Europe.
- 252,908,000 – Internet users in North America.
- 179,031,479 – Internet users in Latin America / Caribbean.
- 67,371,700 – Internet users in Africa.
- 57,425,046 – Internet users in the Middle East.
- 20,970,490 – Internet users in Oceania / Australia.

Social media
- 126 million – The number of blogs on the Internet (as tracked by BlogPulse).
- 84% – Percent of social network sites with more women than men.
- 27.3 million – Number of tweets on Twitter per day (November, 2009)
- 57% – Percentage of Twitter’s user base located in the United States.
- 4.25 million – People following @aplusk (Ashton Kutcher, Twitter’s most followed user).
- 350 million – People on Facebook.
- 50% – Percentage of Facebook users that log in every day.
- 500,000 – The number of active Facebook applications.
Images
- 4 billion – Photos hosted by Flickr (October 2009).
- 2.5 billion – Photos uploaded each month to Facebook.
- 30 billion – At the current rate, the number of photos uploaded to Facebook per year.
Videos
- 1 billion – The total number of videos YouTube serves in one day.
- 12.2 billion – Videos viewed per month on YouTube in the US (November 2009).
- 924 million – Videos viewed per month on Hulu in the US (November 2009).
- 182 – The number of online videos the average Internet user watches in a month (USA).
- 82% – Percentage of Internet users that view videos online (USA).
- 39.4% – YouTube online video market share (USA).
- 81.9% – Percentage of embedded videos on blogs that are YouTube videos.
Web browsers

Malicious software
- 148,000 – New zombie computers created per day (used in botnets for sending spam, etc.)
- 2.6 million – Amount of malicious code threats at the start of 2009 (viruses, trojans, etc.)
- 921,143 – The number of new malicious code signatures added by Symantec in Q4 2009.
Data sources: Website and web server stats from Netcraft. Domain name stats from Verisign and Webhosting.info. Internet user stats from Internet World Stats. Web browser stats from Net Applications. Email stats from Radicati Group. Spam stats from McAfee. Malware stats from Symantec (and here) and McAfee. Online video stats from Comscore, Sysomos and YouTube. Photo stats from Flickr and Facebook. Social media stats from BlogPulse, Pingdom (here and here), Twittercounter, Facebook and GigaOm.
More reading:
Internet 2010 in numbers


