 What happened with the Internet in 2008?
How many websites were added? How many emails were sent? How many blog posts were published? This post will answer those questions and many others with more interesting statistics than you can shake a stick at. 🙂
We have used a wide variety of sources from around the Web. A full list of source references is available at the bottom of the post for those interested. In some of the cases we here at Pingdom also did some additional calculations to get even more numbers to play around with.
- 1.3 billion – The number of email users worldwide.
- 210 billion – The number of emails sent per day in 2008.
- 70% – The percentage of emails that are spam.
- 53.8 trillion – The number of spam emails sent in 2008 (assuming 70% are spam).
Websites
- 186,727,854 – The number of websites on the Internet in December 2008.
- 31.5 million – The number of websites added during 2008.
Web servers
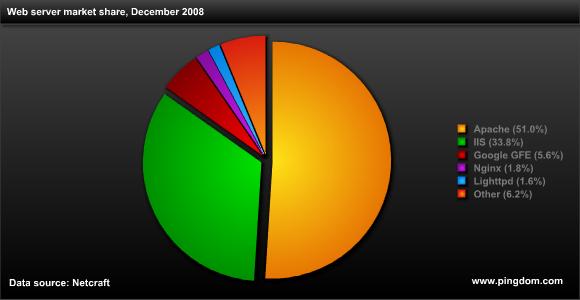
- 24.4% – The growth of Apache websites in 2008.
- 13.7% – The growth of IIS websites in 2008.
- 22.2% – The growth of Google GFE websites in 2008.
- 336.8% – The growth of Nginx websites in 2008.
- 100.3% – The growth of Lighttpd websites in 2008.

Domain names
- 77.5 million – .COM domain names at the end of 2008.
- 11.8 million – .NET domain names at the end of 2008.
- 7.2 million – .ORG domain names at the end of 2008.
- 174 million – The number of domain names across all top-level domains.
- 19% – The increase in the number of domain names in 2008.
Internet users
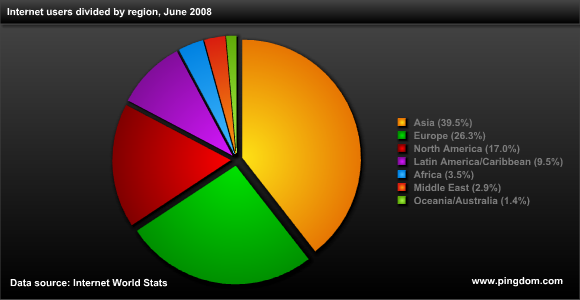
- 1,463,632,361 – The number of Internet users worldwide (June 2008).
- 578,538,257 – Internet users in Asia.
- 384,633,765 – Internet users in Europe.
- 248,241,969 – Internet users in North America.
- 139,009,209 – Internet users in Latin America/Caribbean.
- 51,065,630 – Internet users in Africa.
- 41,939,200 – Internet users in the Middle East.
- 20,204,331 – Internet users in Oceania/Australia.

Blogs
- 133 million – The number of blogs on the Internet (as tracked by Technorati).
- 900,000 – The number of new blog posts in a day.
- 329 million – The number of blog posts in 2008.
Images
- 10 billion – Photos hosted by Facebook (October 2008).
- 3 billion – Photos hosted by Flickr (November 2008).
- 6.2 billion – Photos hosted by Photobucket (October 2008).
Videos
- 12.7 billion – The number of online videos watched by American Internet users in a month (November 2008).
- 87 – The number of online videos viewed per month per Internet user in USA.
- 34% – The increase in viewing of online video in USA compared to 2007.
- 3.1 – The number of minutes of an average online video.
Web browsers

Malicious software
- 1 million – The number of computer viruses in April 2008.
- 468% – The increase in malicious code compared to 2007.
Data sources: Website and web server stats from Netcraft. Domain name stats from Verisign and Webhosting.info. Internet user stats from Internet World Stats. Web browser stats from Net Applications. Blog stats from Technorati. Email stats from Radicati Group via About.com. Spam stats from DCC. Virus stats from Symantec via Times Online. Online video stats from Comscore. Photo stats from CNET and Flickr.


