Learn how to capture insights from the end user down to the application
To keep their applications and websites available and accessible, today’s businesses put a lot of emphasis on infrastructure monitoring to ensure their servers are healthy and running. Amid the hustle, many companies overlook the need to monitor a different aspect of their application: user experience.
Real user monitoring (RUM) helps businesses understand how their users interact with a website. By capturing data from user interactions in real time, RUM tools help you understand whether your website is doing what it was intended to do. RUM data is primarily used by digital marketers and application owners to gain insights into user activity, but site reliability engineers (SREs) can also use data from RUM for issue mitigation and site optimization.
RUM is one aspect of application performance monitoring (APM). Usually, a small snippet of JavaScript code is embedded in a website’s code, and then data from the user interaction is captured and sent to a RUM data aggregation tool. The kinds of data collected include the following:
- Page load times
- Locations of site visitors
- Platforms, devices, and browsers used by site visitors
RUM is a core feature of SolarWinds® Pingdom®. In this post, we’ll walk through how to connect Pingdom RUM with your WordPress site by installing and setting up a WordPress plug-in. Then, we’ll consider some examples of how insights from RUM tools like Pingdom can help you make data-driven decisions to optimize your WordPress site and improve the experience of your end users.

Why Use Real User Monitoring With WordPress?
WordPress is a powerful and popular content management system (CMS) with a large user community and a massive ecosystem of plug-ins. At the end of 2021, it was estimated over 455 million sites use WordPress, with 70 million new blog posts coming out on WordPress each month. With its active developer community and massive library of plug-ins, WordPress is popular, to say the least.
By understanding how your users interact with your WordPress site—which is where RUM comes in—you’ll know how to better optimize your site for those users. Some might argue a full APM suite is overkill for a WordPress deployment. However, if you just need RUM, then Pingdom is an excellent standalone solution.
Setting up Pingdom and WordPress
We have a WordPress 5.8 deployment running in a DigitalOcean VPS, which we spun up from a marketplace image. The image provides everything—Apache web server, MySQL database, and WordPress installed. The initial site has two sample blog posts.
Pingdom Account and RUM Site Setup
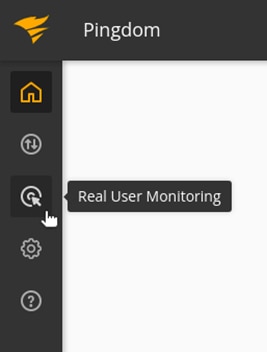
Let’s get started by setting up Pingdom. If you don’t already have an account with Pingdom, you can create a new account with a free trial. Once you’re logged in, click on Real User Monitoring in the sidebar navigation.
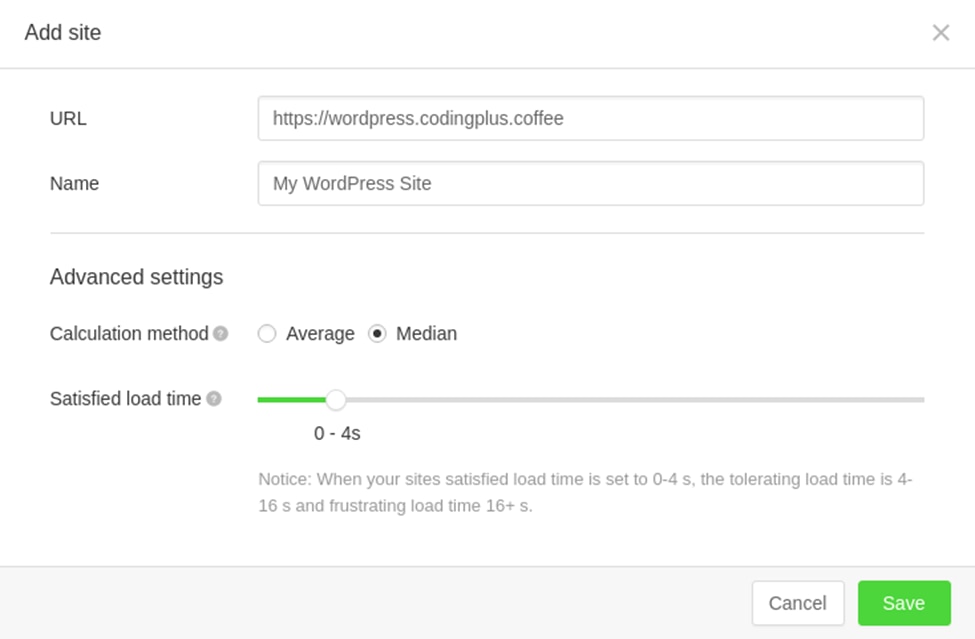
Next, click the “add a site to monitor” button. Enter the URL for your WordPress deployment and click Save.
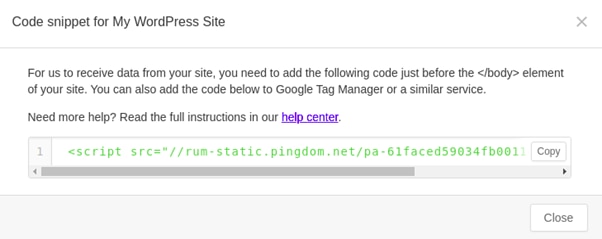
After saving the site, Pingdom will show you a code snippet you’d ordinarily use to paste into your site code. Since we’ll be using the convenient Pingdom plug-in for WordPress, we won’t need to paste in a code snippet, so you can ignore this snippet and close the dialog.
Install Pingdom Plug-In for WordPress
In WordPress, install the Real User Monitoring by Pingdom plug-in. While logged in to your WordPress site as an administrator, click on Plugins | Add New.
In WordPress, install the Real User Monitoring by Pingdom plug-in. While logged in to your WordPress site as an administrator, click on Plugins | Add New.

Search for the plug-in with Keyword “pingdom.” Once you find the plug-in, click Install Now.
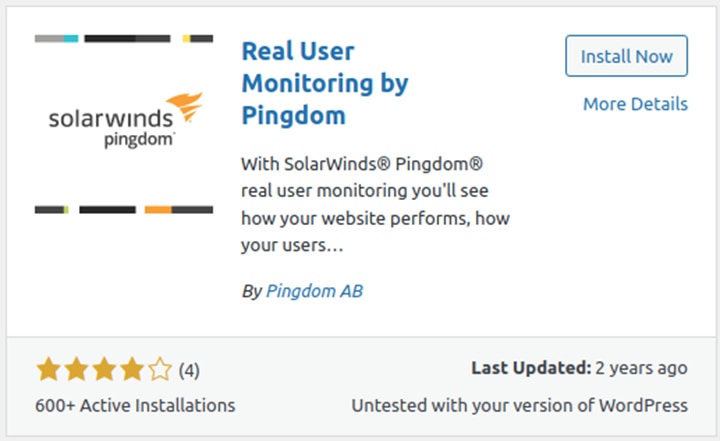
After installing the plug-in, click Activate. Next, in your list of installed plug-ins for WordPress, find the newly installed Pingdom plug-in and click on Settings. You’ll be asked to paste in your Real User Monitoring Site ID. In Pingdom, when you’re viewing the RUM details for your site, you’ll be at a URL similar to the following:
https://my.pingdom.com/app/3/visitor-insights/61faced59034fb0011000723/experienceThe highlighted code in the above URL is your RUM Site ID. Copy and paste this value into the WordPress plug-in settings. Then, click Save Changes.

That’s all there is to it! We’ve set up our Pingdom account along with our RUM site. We’ve added the Pingdom plug-in to WordPress and configured the plug-in with our RUM site ID.
Simulate User Activity and Verify RUM Data
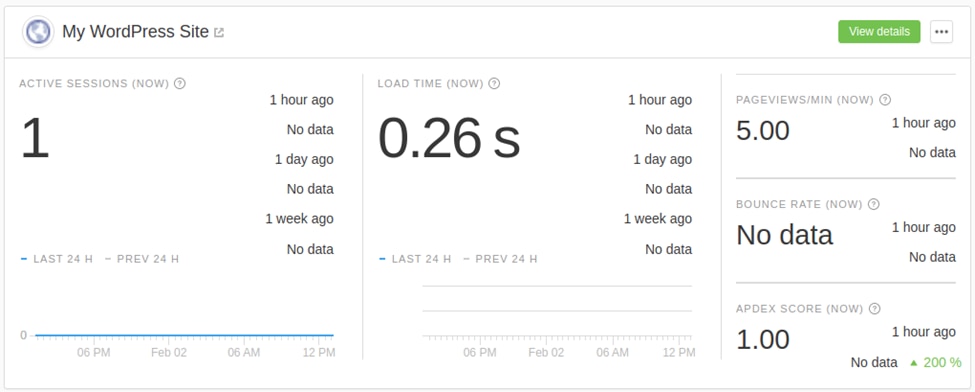
In our browser, we can visit our WordPress site and click through several pages to simulate some user activity. Once we go to Pingdom and refresh the RUM data for our site, we’ll begin to see statistics for our most recent visit:
Usage Examples
In the previous section, our demo site was decidedly small, and our test request load was low. The purpose was simply to show how to set up Pingdom and WordPress to work together. Let’s consider some examples of how RUM data from a production-grade WordPress site can yield actionable insights.
Example 1: Page Load Times and CDN Regions
Pingdom provides visualization for page load times based on geography. You can see—either as a map or as a table—how quickly (or slowly) pages load for your users in different regions of the world.
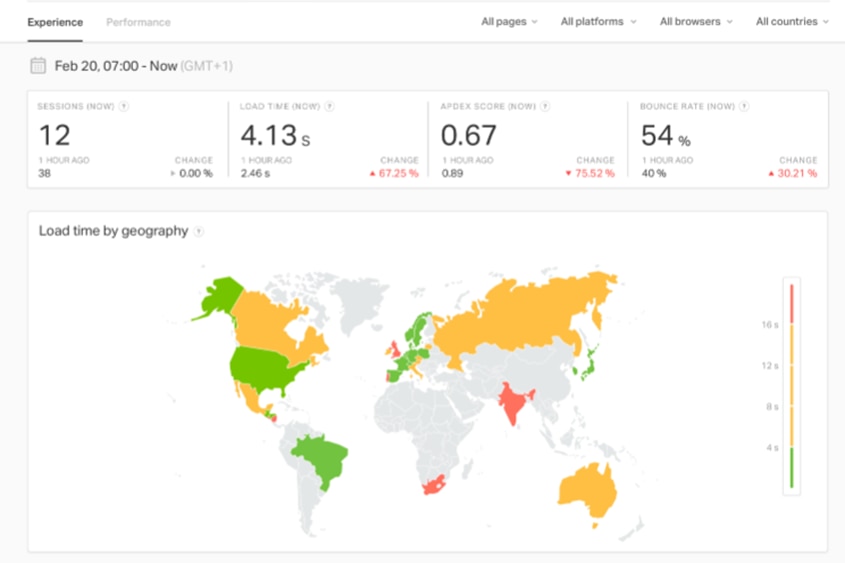
This kind of insight may affect how you choose regions for your content delivery network (CDN). Would it be worth it to spin up additional instances of WordPress and use a CDN for better distribution to the East Asia region or the South Pacific region? RUM data can help you make this decision.
Example 2: Platforms, Devices, and Compatible Themes
Your WordPress site likely uses a theme—possibly one you paid good money for. It looks beautiful on a desktop screen, with smooth navigation, crisp images, and flowing transitions. The mobile and tablet versions of the theme are fairly lacking, but the perfection of the desktop version seems like it’s worth the hit.
However, if your RUM data were to show 95% of your WordPress site visitors are on their mobile devices, this kind of hard data might make you think about the theme you use. The RUM tools in Pingdom can segment your page load times and page view counts by platform and device to give you actionable insights.

Example 3: A/B Testing
At times, you may direct traffic to your WordPress site through advertising or marketing campaigns. A/B testing is the approach of directing users to one of two versions of a campaign landing page to test which version is better received by your visitors.
You can use insights from RUM to compare the exit rates of the two different page versions or to see which version was more effective in leading users further through the conversion funnel.
Example 4: Improving Your Apdex Score
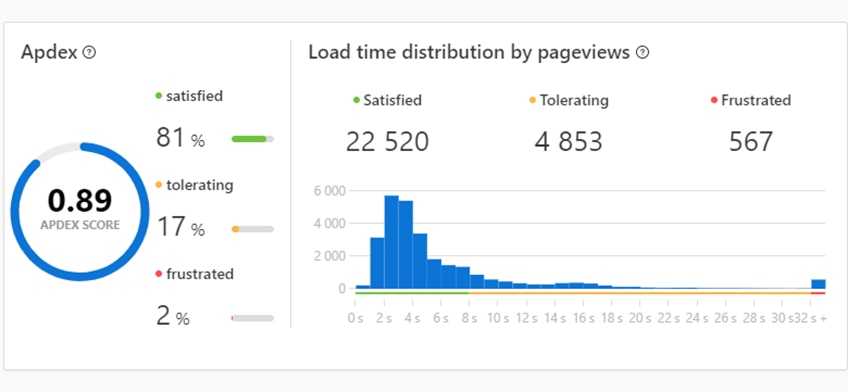
The RUM tools in Pingdom also provide an Application Performance Index (Apdex) score for your site. The Apdex is a score designed to help you compare the performance of your site against user expectations. By measuring page response times against standard times, your Apdex score helps you understand how many of your visitors are satisfied, tolerating, or frustrated by their experience.
Example 5: Pageviews Over Time
The RUM visualizations in Pingdom also allow you to examine pageviews over time to yield the following insights:
- Peak days or times for site traffic, helping you drive decisions about resource allocation or campaign scheduling
- Whether campaigns—or external factors—drove traffic to or away from your site at certain times
- Which areas of content on your WordPress site are most successful in retaining visitors or funneling them toward calls to action
Go Deeper With Log Management
We’ve looked at how Pingdom can work alongside your WordPress site to give you data from real user monitoring. This data yields helpful insights into the actual experience for your end user and—ultimately—the overall effectiveness of your site.
If you’re interested in going a level deeper to see and analyze the underlying logs related to your WordPress site, we recommend you continue reading about how to use SolarWinds Papertrail™ for WordPress log management.


