I’ll be the first to admit one of my weaknesses is public speaking. I spend hours before a training session, online seminar, or live event rehearsing exactly what I want to say and how I want to say it. But all my time spent practicing an engaging presentation only mildly prepares me for the moment I’m in front of others and it’s my time to speak. Because while a shaky voice and racing heart are uncomfortable to me, the audience can be left with a confusing experience that doesn’t meet their expectations.
No, this post is not a confessional.
Though web applications don’t exactly face stage fright in front of the public, they can also leave their audience with a disappointing experience.
Think about it—if you listened to my practice presentations, they’d be stellar. But performance isn’t just about what happens in practice or in a development environment. Your applications will be judged based on how your users experience them out in the wild every single day. So even though metrics related to infrastructure capacity and request rates are important for understanding the back end of your application, they miss the quality of the experience with the applications driving business performance.
The Traditional State of Application Monitoring
A gap exists for IT ops and DevOps professionals dividing traditional server and application monitoring from the future state of monitoring. In the past, operations didn’t have to bridge the back-end performance of a web application with how users interact with it—this could be monitored by the web and digital marketing teams.
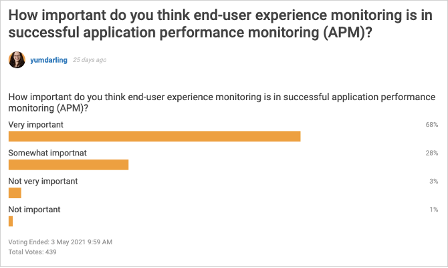
But as a recent poll of our THWACK® community suggests, end-user monitoring is becoming a critical strategy for successful application performance monitoring.

One user even pointed it out with a straightforward question.

Full-stack monitoring is becoming fuller with the additional emphasis on end-user experience monitoring. There’s new attention on the health of web applications—what the average page load speed is and how it differs across the world. A new lead, potential sale, or current customer could be anywhere, and operations teams are charged with making sure websites are accessible and fast. Even more, operations teams must keep websites up throughout modern challenges such as data center migrations, the move to hybrid/cloud environments, and scaling alongside the business.
Pingdom for the Ops Pros
You’re busy, you’re usually working under critical time pressure, and you’re the person who developers, other teams, and your boss come to when an application goes down. It’s at this moment your day becomes a fire drill.
SolarWinds® Pingdom® is the leading software as a service (SaaS)-based end-user monitoring tool for web applications, and it’s designed to help you get ahead of fire drills and keep your business-critical applications running as they should. By combining synthetic and real user monitoring (RUM), Pingdom helps you identify bottlenecks and prioritize which fixes demand your time and effort. Pingdom is easy to get started with and simple to use without sacrificing powerful user insights. This tool can help you answer the following questions:
- Are users experiencing issues with the app?
- How many users is this problem affecting?
- What types of users are being affected?
- What’s the source of the problem?
The data in Pingdom even helps you determine whether an incident is isolated to a specific population, like if it’s only impacting those on a certain browser, device type, or geographic location.
Conclusion
If you’re responsible for web applications when they go down, server-side monitoring tools are only half the story. They can’t alert you of an issue when everything on the back end is showing green. This misses your users and the quality of their experience on your site, which can translate to business performance.
Pingdom is here to monitor your applications from an outside-in approach, so if your application ever gets a case of stage fright, you can fix it before your users even notice. Get started with a 30-day free trial of Pingdom.


