We love our page speed test and, considering the amount of traffic coming into tools.pingdom.com, we have a feeling you guys love it, too.
Hence, it was with a slight feeling of apprehension that we started working on giving the page, and primarily the back-end functions, a much-needed revamp.
After all, if it’s not broken, why fix it?
Unfortunately, we didn’t have much of a choice. The lifespan of websites and digital projects are, at best, counted in dog years, and this one was way past its prime.
So, after working hard on giving the test some much-needed TLC, we are finally ready to launch the new tool to the rest of the world.
Drumroll, please!

We know what you’re thinking.
That looks exactly the same as the old version.
Don’t judge a book by its cover
Don’t be fooled by the not-so-dramatic-makeover (most of the changes are in the back end!). Let us tell you a bit about all the magic stuff we added:
Improved stability
Our servers are growing tired. To be honest, with the number of tests they process, we don’t blame them— and it’s about time we retire them. So we’re migrating the entire Page Speed Test to the same stable environment we use for the Page Speed Monitoring within the Pingdom® interface (i.e., solid AWS servers).
We’re adding better coverage

Location is key, and we’re upping our game. We have yet to cover the entire globe, but we’re getting there! Here are the new locations that you will be able to test your site from:
North America – U.S. – San Francisco
North America – U.S. – Washington D.C
Asia – Japan – Tokyo
Pacific – Australia – Sydney
Europe – Germany – Frankfurt
Europe – U.K. – London
South America – Brazil – São Paulo
Note that the North American locations are estimates. The AWS locations are kept secret (very James Bond if you ask us).
See how your page loads
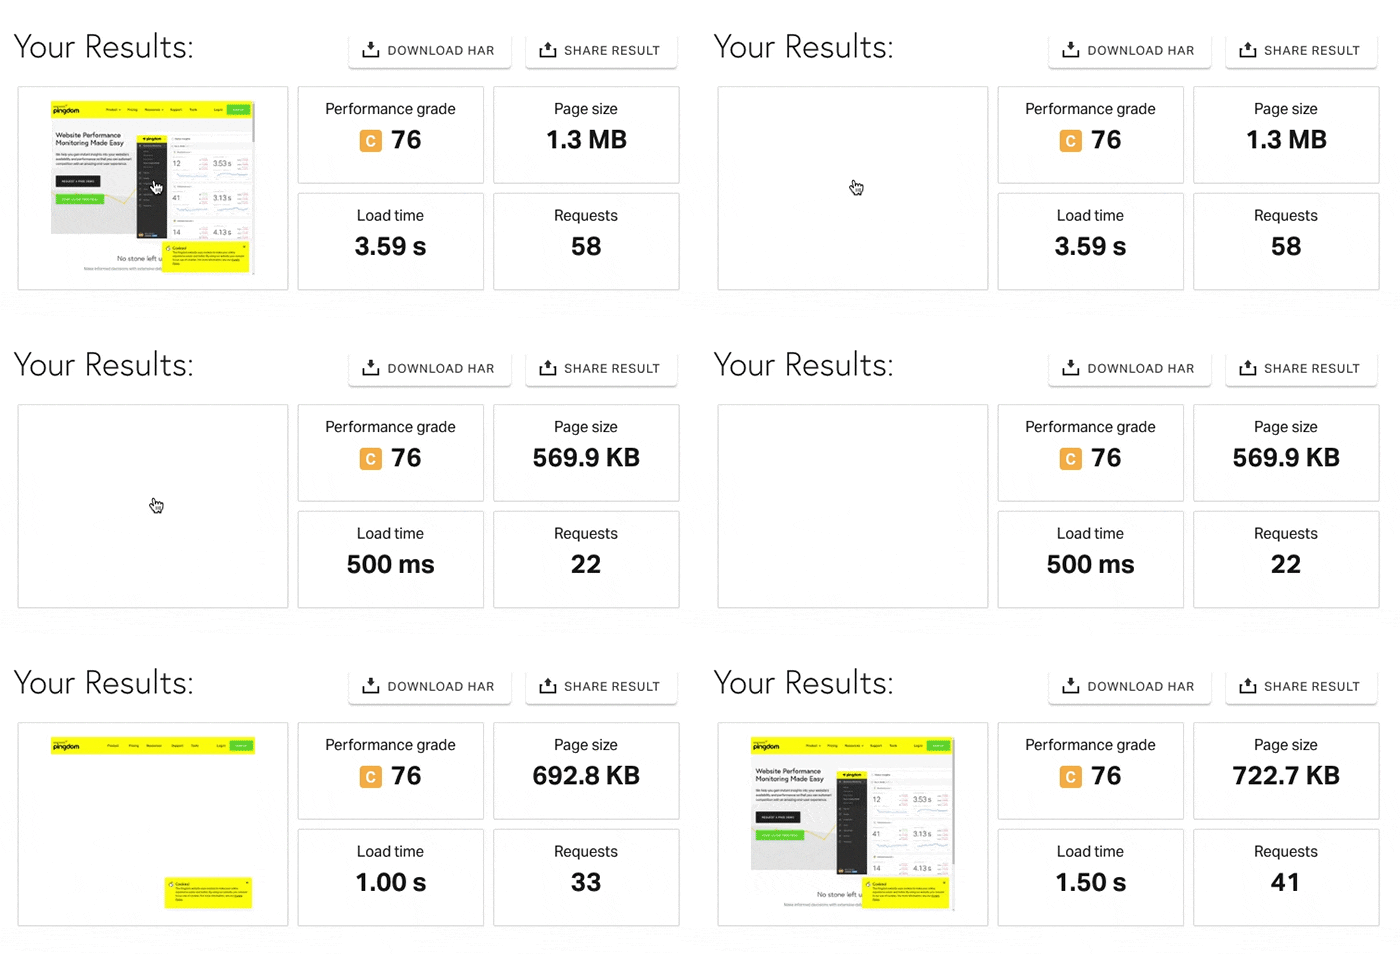
This is a bit of an Easter egg. Press the thumbnail of your page and see how it loads—element by element, request by request. Neat, no?

Filter your results
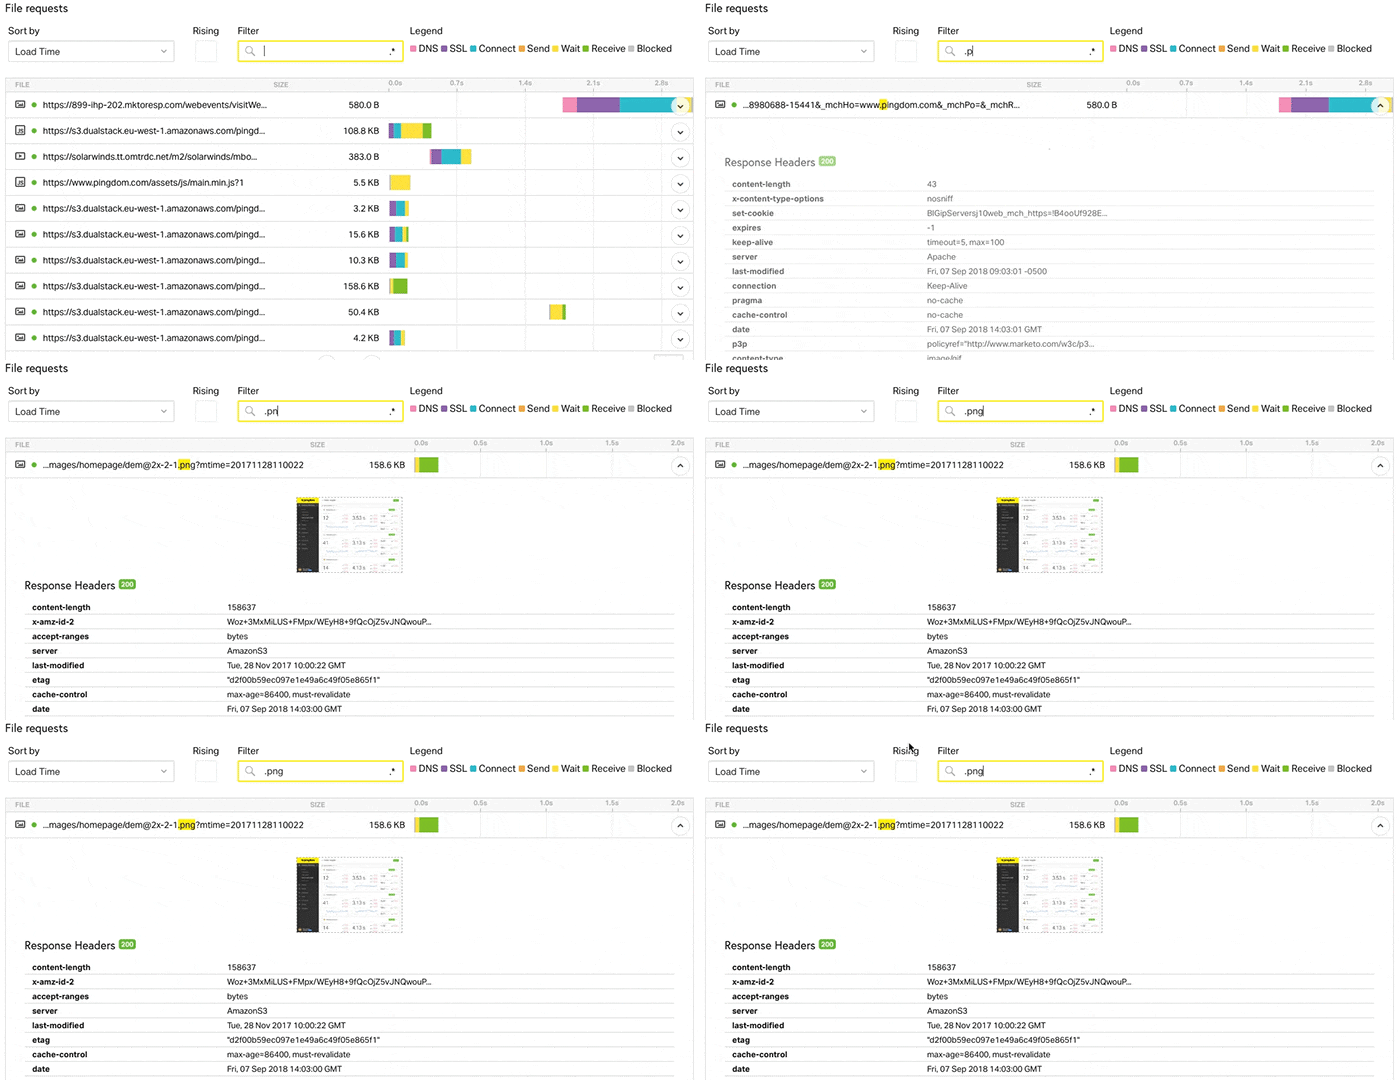
No more scrolling! Already have a hunch on what’s ruining your page speed? Search for the element in question and get immediate results.

Easier Overview
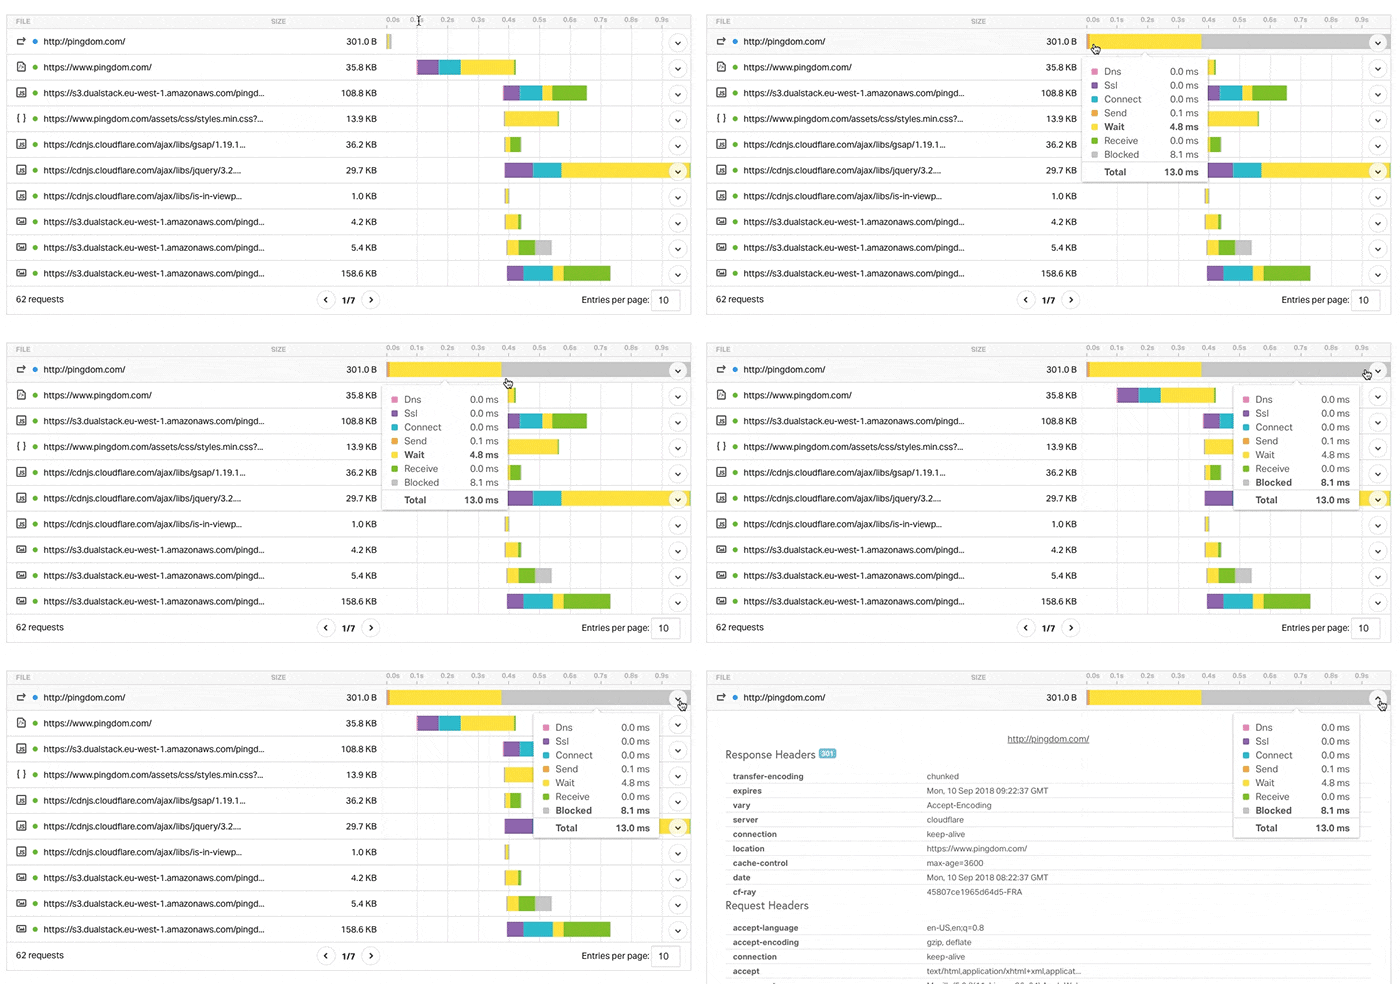
Once again, less scrolling for you. We’ve added pages to the waterfall chart. You’re welcome. (For those of you who hate pagination: simply increase the number of rows visible.)
Hover and Zoom
You no longer need hawk-eyed vision to analyze those tiny tidbits in your waterfall chart. Simply hover on the element you want to take a closer look at and get the full picture.

A cheat sheet for all those abbreviations

Because sometimes keeping track of all those potential response codes can be confusing.
We’re going mobile
It’s about time! The page will now be 100% mobile compatible. Enough said.

At first sight it might not look like much, but we do hope you enjoy these added features. Feel free to leave your honest feedback in the comments below!


