![]() Twitter processed 1.76 billion tweets in April. This is already significantly more than Twitter was handling in January (1.2 billion tweets). Counted in tweets, Twitter is growing like crazy.
Twitter processed 1.76 billion tweets in April. This is already significantly more than Twitter was handling in January (1.2 billion tweets). Counted in tweets, Twitter is growing like crazy.
So how many tweets will Twitter be handling by the end of the year? Based on Twitter’s growth rate until now, let’s try to predict what the rest of the year will look like (and make a pretty chart while we’re at it).
How much more do we tweet each month?
The number of tweets that pass through Twitter has been growing rapidly for a long time now. Twitter’s month-by-month growth in tweets the last six months looks like this:
- Nov 2009: 16.8%
- Dec 2009: 16.6%
- Jan 2010: 16.9%
- Feb 2010: 15.6%
- Mar 2010: 16.3%
- Apr 2010: 15.4%
For the record, it’s now May 2010.
Over these last six months, the average per-month increase is 16.3% and no month has deviated much from this value. Still, let’s round it down and say that growth is about 16% per month.
This consistency is interesting. Looking back farther, Twitter’s growth rates were not this consistent from month to month, but it looks like Twitter’s growth has reached a rather stable rate and it has held for half a year now.
Let’s assume that Twitter manages to keep up this growth rate for the rest of the year. What would happen then? Remember, each month those 16% will correspond to an increasingly large number of tweets.
Predicting Twitter’s growth for the rest of the year
Based on Twitter’s growth over the past six months, the number of tweets per month will be massive by the end of the year.
How massive? A monthly growth of 16% may not sound earth shattering, but that means that the amount of tweets per month would grow 494% in a year (12 months). This would actually be less, percentage wise, than in 2009, but Twitter is bigger now so each percent will mean a larger and larger number of tweets.
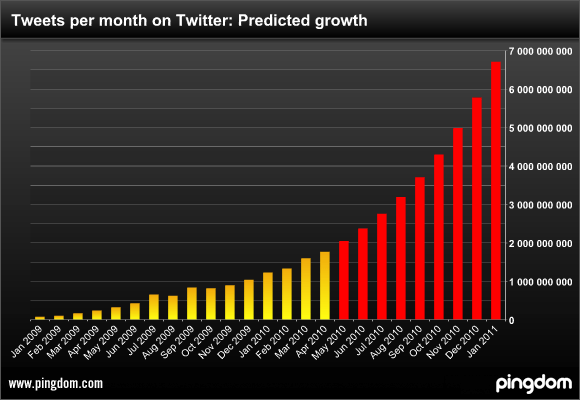
Here is the predicted growth in monthly tweets (in red) through January 2011:

Above: Past number of tweets per month in yellow. Predicted growth in red (May 2010 and onward).The predicted growth is calculated based on the growth the past 6 months.
So if tweet activity keeps growing by 16% each month, we will have gone from the 1.2 billion tweets of this January to a massive 6.7 billion tweets in January 2011. Not a bad increase over just one year.
A few other observations:
- Twitter looks set to pass 2 billion tweets in May (this month!). This is a doubling since December 2009, which was the first month Twitter passed 1 billion tweets.
- In December, Twitter will process almost 5.8 billion tweets. That’s almost 6 times as many as in December 2009.
- By January 2011, activity on Twitter will be increasing with almost 1 billion tweets per month.
Can Twitter maintain its momentum?
The bigger Twitter gets, the harder it will be to keep up a big growth rate counted in percentages. This is because every month, that same percentage is the equivalent of more and more tweets.
After seeing that impressive graph that is based on the growth Twitter has experienced during the past six months, the question is, can Twitter maintain its momentum throughout the year?
We don’t know, but it wouldn’t surprise us. By any measure, activity on Twitter is increasing significantly every month. Even if Twitter were to not match the current 16% monthly growth, it would still grow big time. For example, growing 10 percent per month becomes 214% over a year (i.e. the number of tweets would more than triple).
Conclusion
Things can change fast in the world of social networking. One year is often enough of a timeframe to launch a new star or start the downfall of a former giant (hello Facebook, bye bye MySpace). But unless something drastic happens, it looks like Twitter is set for one heck of a 2010.
And if this prediction holds true, Twitter has some scaling to think about. By the end of the year, it’s going to have three times as many tweets to process as it does today.
Final note: If you’re interested in how we found out how many tweets are passing through Twitter, have a look at this post from a few months ago. In it we explain how we did it:


