We decided to analyze how five of the most talked-about web hosting companies have grown over the last few years. The results are really interesting.
Since we didn’t have inside information about these companies, we looked at the number of domain names on their DNS servers, and how these numbers have changed over time (from April 2005 to December 2007).
The web hosting companies we included are:
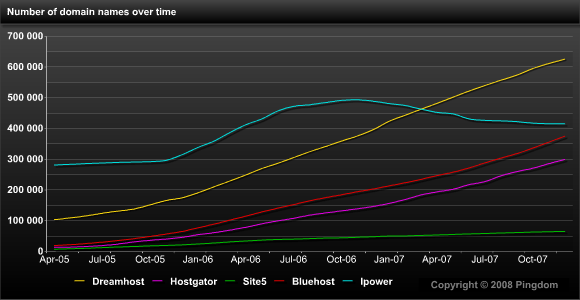
- Dreamhost (625,470)
- Ipowerweb/Ipower (414,788)
- Bluehost (374,965)
- Hostgator (299,463)
- Site5 (64,737)
(Domain names in December of 2007 within parenthesis above.)
Number of domain names over time
This graph shows how the total number of domain names have changed over time for the five included web hosting companies.

Factors that affect growth
We find it interesting how much the growth rate differs between the various companies. For example, we were surprised that Site5 didn’t have more domain names considering how well known they are. If you compare them with Bluehost and Hostgator, which they were close to in 2005, their number of domain names have lagged behind significantly.
Many of us here at Pingdom have a past in the web hosting industry, and over time we have seen many approaches that web hosting companies use to increase their user base.
Some factors that often help web hosting companies grow are:
- Aggressive affiliate programs, offering plenty of profit sharing and perks to affiliates.
- Reseller programs.
- Blogging and being open about their business and the company, usually with a personal touch, giving insights and creating discussion. Dreamhost is very good at this.
- Discussions in blogs and forums.
- Overselling (a hotly debated topic, but nevertheless a fact).
- Lowering hosting prices (often in connection with campaigns).
- Lowering domain name prices.
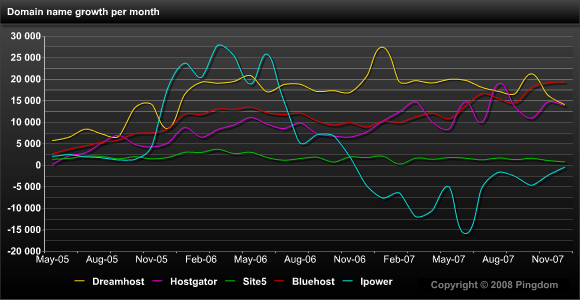
A good example of how one single aspect can have a major impact is the Ipowerweb growth spike that started in November 2005. This was in all likelihood fuelled by the announcement that they had dumped their domain name prices to a at that time record-low price point of $2.95. This would maybe also explain the dip that starts about a year later when people either did not renew their domain names or moved them away, since the renewal price was not as low.
To be able to easier see how the growth has changed from month to month we also made a separate graph for that.
Growth in domain names per month
This graph shows the net growth in domain names per month for each of the five web hosting companies, i.e. how much they gained or lost a particular month.

Do you have your own take on the numbers presented here? There are so many factors involved, so please feel free to share your thoughts and opinions with us in the comments!
Some notes on the data
We analyzed root zone files for the .com, .net, .org, .biz and .info top-level domains (which we lovingly tend to call CNOBI domains 🙂 ) taken from the time period between April 2005 and December 2007.
Purely using domain names as a basis for estimating the size or success of a web hosting company has some limitations. For example, the website for a domain name could be hosted somewhere else, or it could just be a parked, unused domain name. There will also be a certain number of websites that use other DNS servers than those provided by the web hosting company.
We have done our best to identify the DNS servers of these companies, but there is always the odd chance that we have missed one (though it’s quite unlikely in this case).


