Synthetic Monitoring

Simulate visitor interaction with your site to monitor the end user experience.

View Product Info

FEATURES

Simulate visitor interaction

Identify bottlenecks and speed up your website.

Learn More

Real User Monitoring

Enhance your site performance with data from actual site visitors

View Product Info

FEATURES

Real user insights in real time

Know how your site or web app is performing with real user insights

Learn More

Infrastructure Monitoring Powered by SolarWinds AppOptics

Instant visibility into servers, virtual hosts, and containerized environments

View Infrastructure Monitoring Info
Comprehensive set of turnkey infrastructure integrations

Including dozens of AWS and Azure services, container orchestrations like Docker and Kubernetes, and more 

Learn More

Application Performance Monitoring Powered by SolarWinds AppOptics

Comprehensive, full-stack visibility, and troubleshooting

View Application Performance Monitoring Info
Complete visibility into application issues

Pinpoint the root cause down to a poor-performing line of code

Learn More

Log Management and Analytics Powered by SolarWinds Loggly

Integrated, cost-effective, hosted, and scalable full-stack, multi-source log management

 View Log Management and Analytics Info
Collect, search, and analyze log data

Quickly jump into the relevant logs to accelerate troubleshooting

Learn More

After 2 million tests, Pingdom Tools v2.0 has arrived

Pingdom Tools is a free set of web-based tools for webmasters and other web-curious people. We launched it this summer and it has proven extremely popular. So far, more than two million tests have been performed with its graphical website load time, ping and traceroute tests.

We have just added a major improvement to this tool: The ability to save tests, which can then be accessed by anybody through a direct link.

Why is this so cool?

  1. Because you can see exactly how a site was behaving at a specific point in time.
  2. It becomes extremely easy to share the results of a test so others can examine it.

Since the AJAX-based graphical interface of Pingdom Tools makes it easy to pinpoint why a site is slow (or down, for that matter), a lot of people post screenshots of tests in forums and blogs. Web hosts can also use Pingdom Tools when communicating with their users, or vice versa. We wanted to give even more power to those users.

Pingdom Tools Full Page Test

With the new save and link features sharing this information will be easier than ever. Just save your test and you will have a permanent link you can send to anyone as proof. They will be able to see exactly the result you got and when the test was performed.

A saved test is much better than just a screenshot, because you can properly examine, sort and filter the saved result.

And if a site is down, you have the Ping and Traceroute tools to help you find potential connectivity problems.

See all previous test results

You will now be able to see a list of all previous (saved) tests of a website when you perform a test in Pingdom Tools. In March, you will be able to go back and look at tests that you or anyone else performed in January. If a website is tested regularly, you will have a really handy list of historical tests to look at. This gives you lots of opportunities to compare “before-and-after” results, to name just one possibility.

Pingdom Tools test history

With this feature Pingdom Tools has become a lot more powerful, and the more people use it, the more powerful it will become.

Share, share and share some more

We are very happy about all the positive feedback we have received about Pingdom Tools and that so many people are using it. We hope that these new additions will help people share test results among themselves to an even greater degree and that Pingdom Tools will keep acting as a great resource to the webmaster and web developer community (and everyone else as well!).

Note: Currently all Pingdom Tools tests are performed from Dallas, TX, USA. More locations will be added in the future.

Read more about how to use Pingdom Tools to analyze websites.

SolarWinds Observability SaaS now offers synthetic transaction monitoring

Powerful transaction monitoring now complements the availability and real user [...]

Exit Rate vs Bounce Rate – Which One You Should Improve and Why

Tracking your website’s exit and bounce rates will give you insight into how [...]

Introduction to Observability

These days, systems and applications evolve at a rapid pace. This makes analyzi [...]

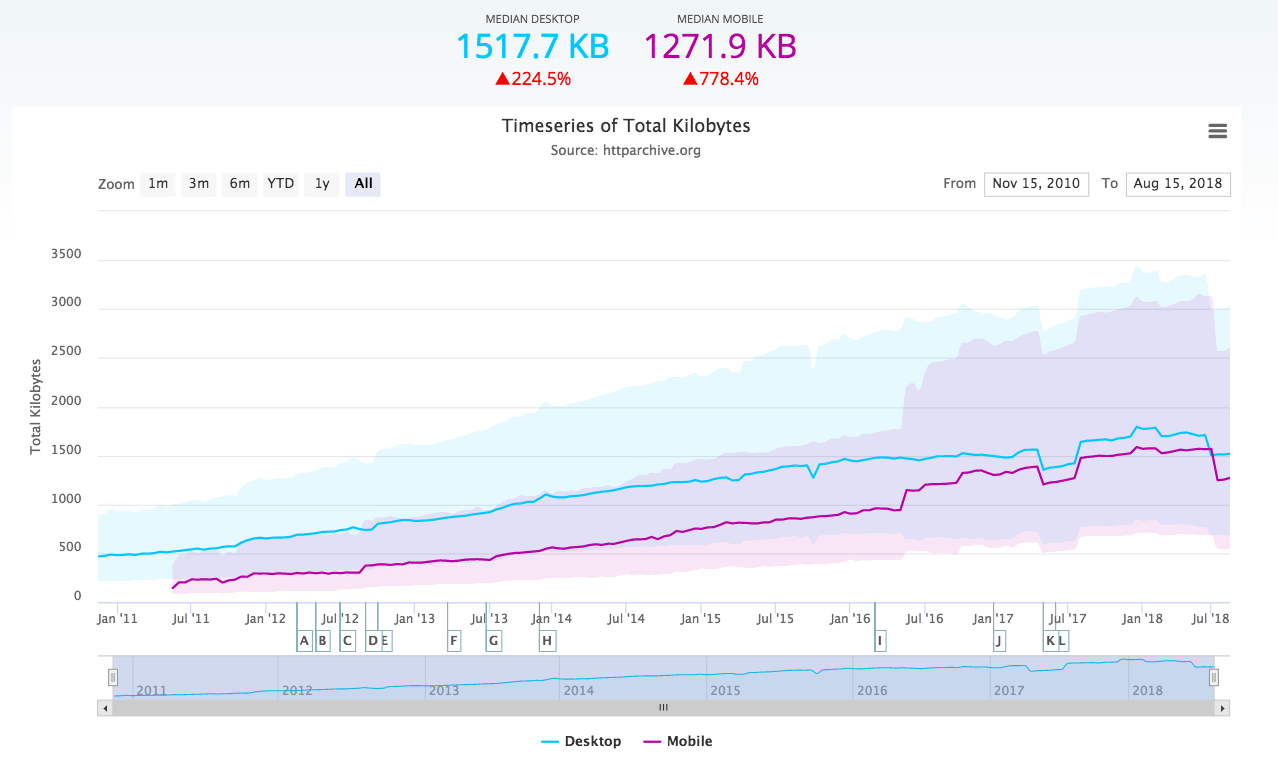
Webpages Are Getting Larger Every Year, and Here’s Why it Matters

Last updated: February 29, 2024 Average size of a webpage matters because it [...]

A Beginner’s Guide to Using CDNs

Last updated: February 28, 2024 Websites have become larger and more complex [...]

Monitor your website’s uptime and performance

With Pingdom's website monitoring you are always the first to know when your site is in trouble, and as a result you are making the Internet faster and more reliable. Nice, huh?

START YOUR FREE 30-DAY TRIAL

MONITOR YOUR WEB APPLICATION PERFORMANCE

Gain availability and performance insights with Pingdom – a comprehensive web application performance and digital experience monitoring tool.

START YOUR FREE 30-DAY TRIAL
Start monitoring for free