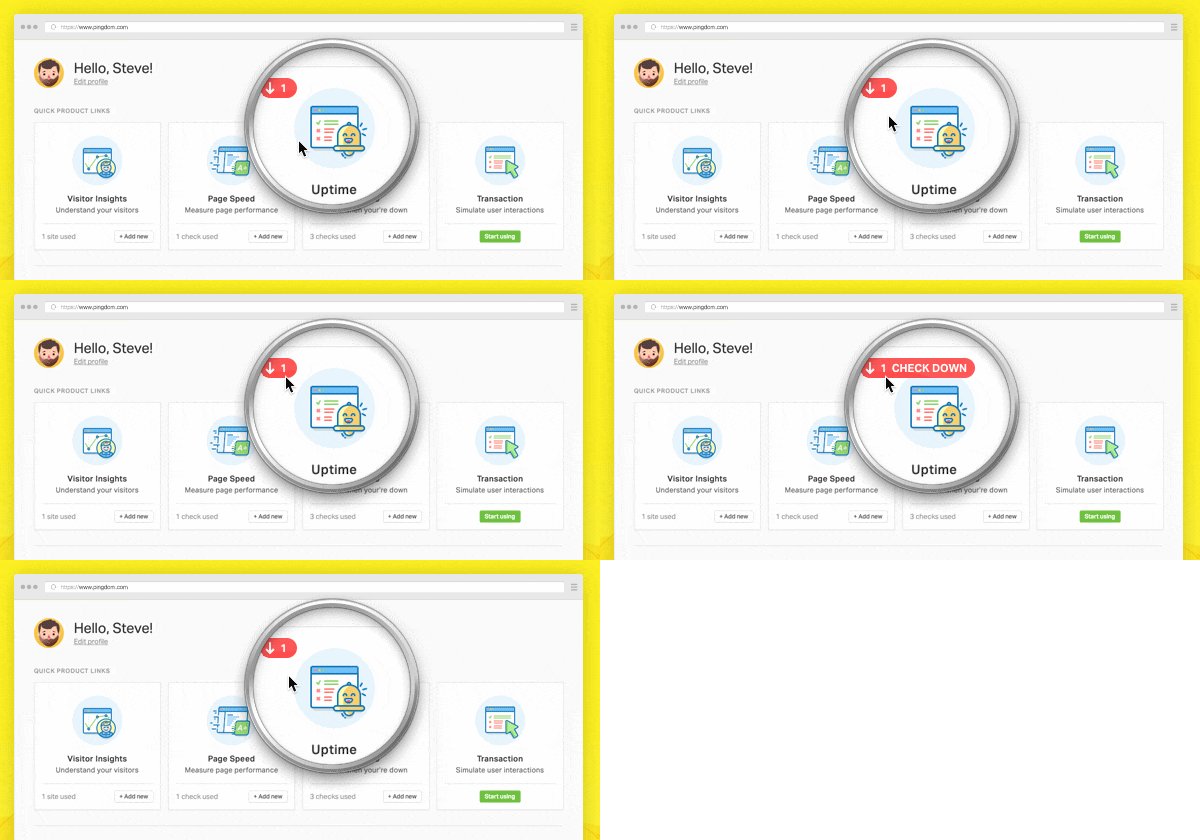
Out with the old, in with the new, as the saying goes. When you log in to our dashboard, you’ll immediately notice a difference in—after a bit of nip and tuck—a new home screen. The home screen in the SolarWinds® Pingdom® dashboard is now a proper home with a better overview of your account and active services. There are also a few quick links tucked in, under the main services, directing you to the most-frequented pages.

When You Give Feedback We Listen
The home screen is a great place to get the easiest overview and make sure you’re not missing out on any features in Pingdom. One of the most frequent requests we’ve received is a way to get easy access and awareness of the features we have. This is, of course, glaringly obvious, and something we’re happy to solve. After all, we want everyone to enjoy the full suite of web performance features we have available. Pingdom is a lot more than just uptime.
What’s New?
- In your dashboard, immediately on the home screen, you now have easy access to all Pingdom monitoring features along with quick links to add new checks.

- The home screen is also sporting a highlighting feature if uptime or transaction checks are down.
- We added quick links to the most visited pages, such as Extra Services, Invoices, and Reports. There’s also a search box where you can search our knowledge base.
Wait, There’s More Than Pingdom Uptime?
We fancy ourselves having a full suite of tools for your web performance monitoring needs. Since the early inception of our uptime monitoring, we have added page speed, real-user monitoring, and transaction monitoring. Using these services will allow you to monitor your entire online infrastructure, so you can discover bottlenecks and errors quickly and deliver a first-class service to your users.
Page Speed
Based on our popular website speed test, we created an automated test for your website’s load time. Since knowing how fast your page loads once isn’t enough, you want to be able to track changes as you continuously deploy code and content to your websites.
Real User Monitoring
While page speed monitoring is tested from data centers around the world, real user monitoring (RUM) is measuring how real users experience the website. Learn how your user’s satisfaction correlates with browsers used, devices, and geographic location. A poor-performing website or application can cost you lost sales and hurt your brand.
Transaction Monitoring
Some interactions on your website are particularly important, and you want to make sure those parts aren’t broken or slow. If there are issues with the login, search form, check out, or any other key interactions on your website, you’ll be the first know and can take actions to fix it.
What’s Next
We believe in an open discussion around what’s best for the monitoring community. And if you want to help shape the next generation of Pingdom features, check out our Customer Advisory Board, so you can let our product team know what’s what. The seats are limited so get yours now, and there’s some nice Pingdom merchandise in stock for those who grab one of the limited seats.
We are rolling out our new home screen slowly and we really want to hear about the experience from you, our users.


