The “Browser Wars” is an ongoing struggle between three, maybe four actors.
Last year, Chrome, Firefox, and Internet Explorer each dominated two regions of the world.
Now, Internet Explorer and Safari keep losing ground, and one browser strengthens its claim to the web browsing throne. Which browser that is comes as no surprise, but some other developments may.
We hereby present this year’s update to the desktop browser wars. First, we give you an overview of the current standings worldwide before we go in to the different regions one by one.
Browser wars by region
Google Chrome is now the most popular browser in four out of six regions around the world. Only users in North America and Oceania seem to still prefer Internet Explorer over Chrome.

You can download a larger version of this chart

You can download a larger version of this chart.
It was only two years ago that Internet Explorer was the dominant browser in the world with about 45% of desktop usage. Today, its share is around 30% and falling.
During the same period, Chrome and Safari are the only two browsers in the top five that have gained in popularity.

Google has with Chrome achieved a very high efficiency in keeping users’ browsers up to date. Chrome’s total usage share is 37% compared to Chrome version 25.0, which, by itself has 33%.
Internet Explorer 10.0, released in August 2012, has yet to reach any significant usage share worldwide. Maybe this is because it only runs on the later versions of Windows.
Let us now take a closer look at the different regions.
Web browser usage in Africa
Since last year, Chrome has taken over the lead in Africa from Firefox. The biggest loser in this region is Internet Explorer that has fallen from 29% to “only” 18%. Firefox has the second highest usage rate in Africa at 37%, compared to almost 40% last year.


Together with South America, Africa is the only region where Firefox 3.6 is still in the top 10. One explanation to this could be that 3.6 was the last version of Firefox before Mozilla started its 6-week rapid release schedule.
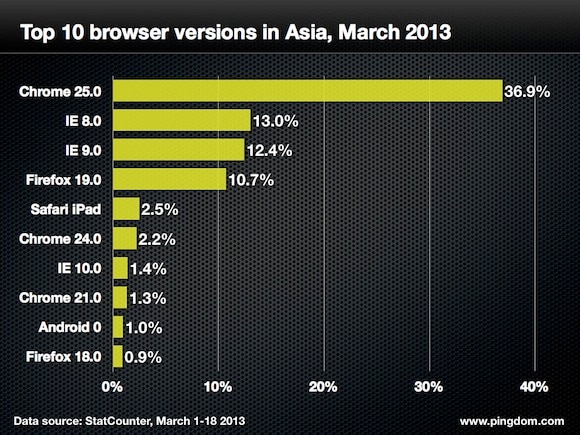
Web browser usage in Asia
Chrome has extended its lead in Asia. But perhaps even more interesting is that the “Others” have grown from 1% last year to 3% this year. The browsers with the largest usage shares in this category are Android (0.95%), Yandex (0.56%) and Soguo Explorer (0.51%).


When a new release of Chrome appears, the previous version seems to die rather quickly. In Asia we can se one exception to this. There, Chrome 21.0 is still one of the ten largest browser versions.
Web browser usage in Europe
Last year, Firefox was the leading browser in Africa and Europe. In both regions, it appears that Chrome has increased in usage at the expense of Internet Explorer.
At 2% usage share, Europe, together with Africa, is also the strongest region for Opera.


Web browser usage in North America
North America is still Internet Explorer’s stronghold, and even though it is getting smaller there to, the decline is not as rapid as elsewhere. Over the year, its usage share has fallen to 39% from 40%. Chrome is in second place at 28%.


Internet Explorer may be the most used browser in North America, but when it comes to individual browser versions Chrome 25.0 is at the top of the list with 24.8%.
There are only two versions of Chrome on the list (24.0 and 25.0), but three versions of Internet Explorer (8.0, 9.0, and 10.0).
Web browser usage in Oceania
Internet Explorer also leads the browser usage in Oceania, but for how long? The gap between Chrome at 29% and Internet Explorer at 33% is getting smaller.
Oceania is the only region where Safari trumps Firefox, reaching the third place with 19% usage share. Including Safari iPad, four of the top ten browser versions are Safari in this region.


Web browser usage in South America
If the Browser Wars would really be called just that, Chrome would already have won decisively in South America.
At 59% usage share for Chrome, the gap to Internet Explorer at 20% and Firefox at 19% is huge.


The browser wars continue
The choice of web browser is for some a very personal decision. Perhaps you have your own personal favorite and try to convince others about its merits. For now it seems like the flavor of the year is Google Chrome for a big chunk of users. This may change, but probably not anytime soon.
Do you have a personal favorite web browser you usually stick to over time? Or do you switch between browsers or even use several browsers? Please let us know via Twitter or in the comments below.
Data: For this article we used web browsing usage share numbers from StatCounter, which are based on visitor statistics averaged from 3+ million websites. In August 2012, StatCounter’s global sample consisted of over 17.1 billion page views.
Image top by Shutterstock


